Welcome to the Cyclistic bike-share analysis case study! This capstone project was completed as part of my Google Data Analytics Professional Certificate.
In this study, I took on the role of a junior data analyst within the marketing analytics team at Cyclistic, a bike-sharing company based in Chicago. The marketing director believes the company’s future growth hinges on increasing the number of annual memberships.
Our team’s goal was to understand how casual riders and annual members use Cyclistic bikes differently. These insights would help us design a targeted marketing strategy to convert casual riders into annual members.
To achieve this, the marketing analytics team needed to answer three key questions: How do annual members and casual riders differ? Why would casual riders consider purchasing a membership? And how can digital media influence marketing tactics?
As the data analyst, it was my responsibility to extract answers from the data and provide actionable recommendations to support these goals.
Objective of the Analysis
The main objectives of the analysis were to answer the following three questions:
• How can Cyclistic encourage casual riders to become members?
• How do annual members and casual riders use Cyclistic bikes differently?
• Why would casual riders consider buying Cyclistic annual memberships?
About the Data
The data I received consisted of trip records for all users during the year 2018. It was provided in four separate datasets, each covering one quarter of the year. Key features in the data included trip start and end times, the names of stations where trips began and ended, and the user type (Subscriber or Customer).
Data Cleaning and Feature Engineering
Our website offers several useful features to help users gather essential information about a city. When you search for a city, you can:
• Standardized column names across all four datasets to enable seamless merging.
• Removed rows with negative trip durations to ensure data accuracy.
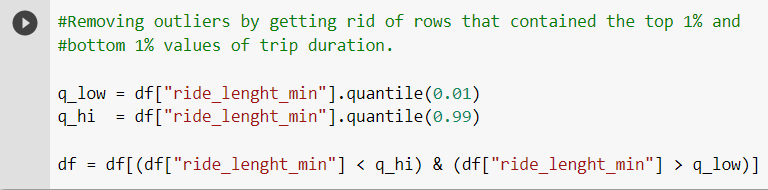
• Eliminated outliers by excluding trips in the top 1% and bottom 1% of trip duration values.
Some of the new features I created include:
• Ride length (minutes) calculated from the ‘start_time’ and ‘end_time’ columns
• Day of the week (Monday to Sunday) extracted from the ‘start_time’ column
• Month extracted from the ‘start_time’ column
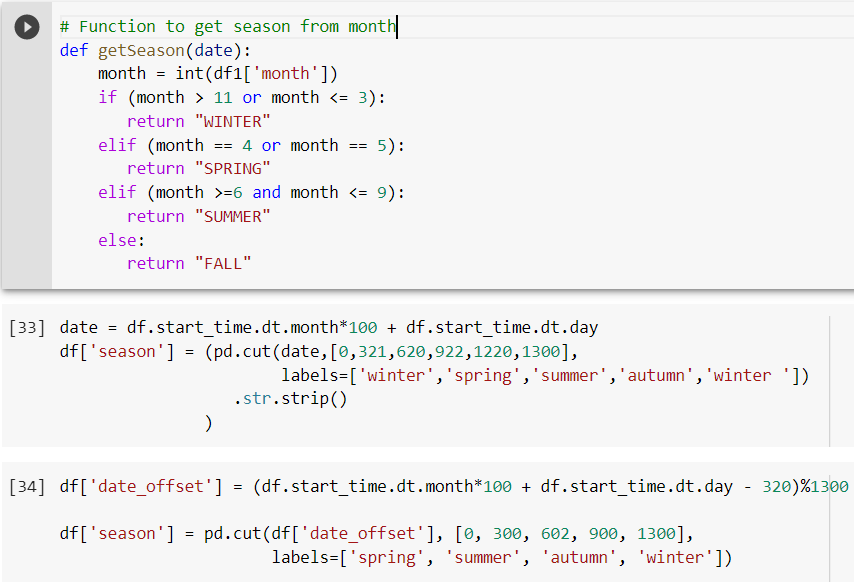
• Season derived from the ‘start_time’ column
Data Analysis
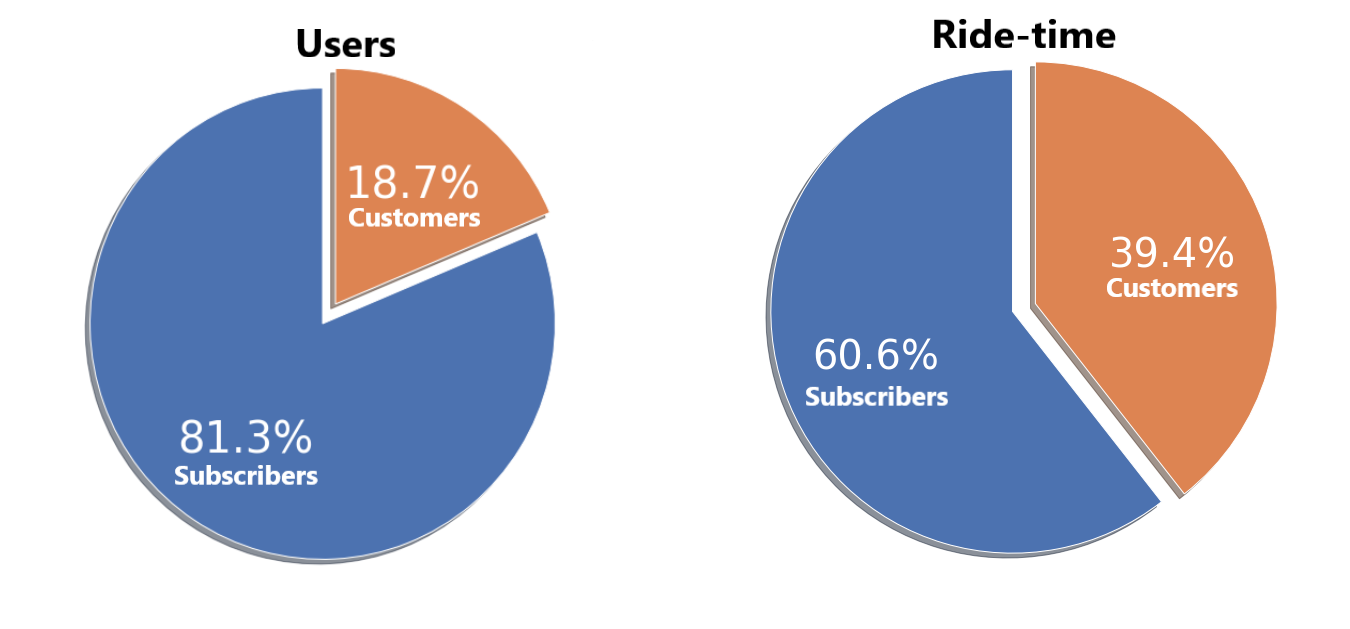
One of my key tasks was to understand our users by analyzing their riding patterns. I discovered that although the vast majority of users are subscribers, casual riders still account for a significant portion of the total ride time.
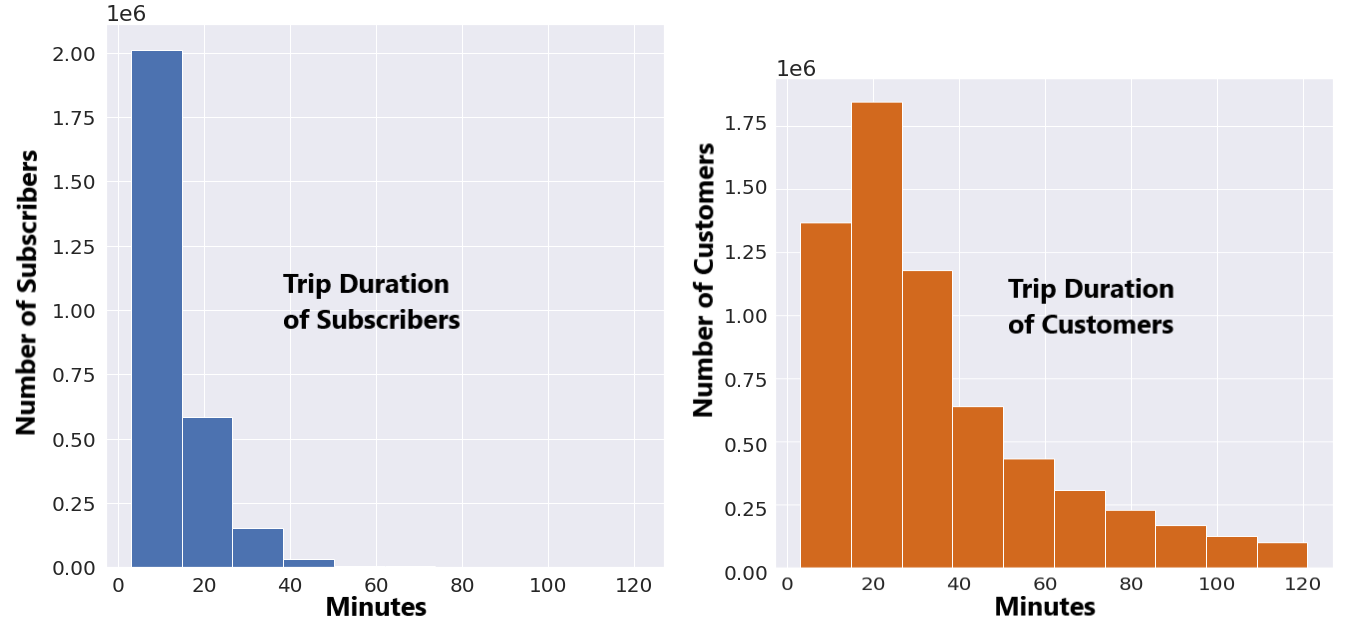
Digging deeper, I found that most subscribers tend to take shorter rides, while casual riders have longer and more varied ride durations.
Next, I examined how trip duration varies depending on the day of the week.
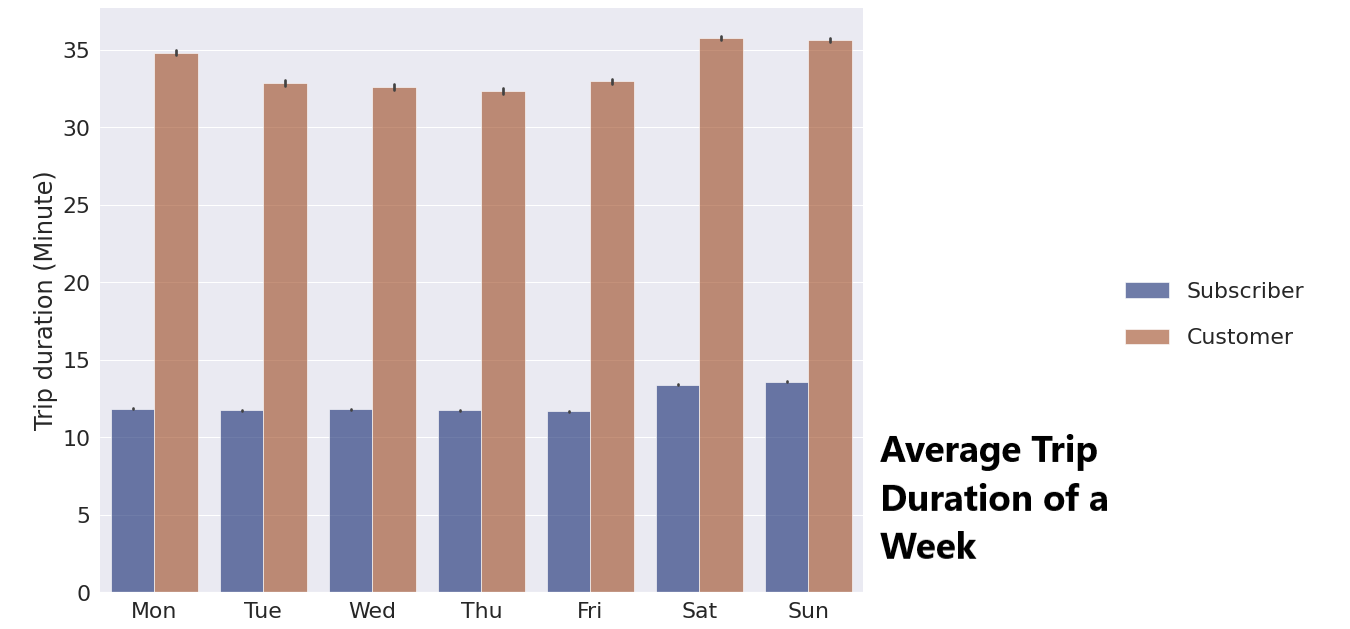
As expected, casual riders tend to ride more on weekends. Interestingly, subscribers also show increased riding activity during weekends compared to weekdays.
I was also curious about how the time of year affects trip duration.
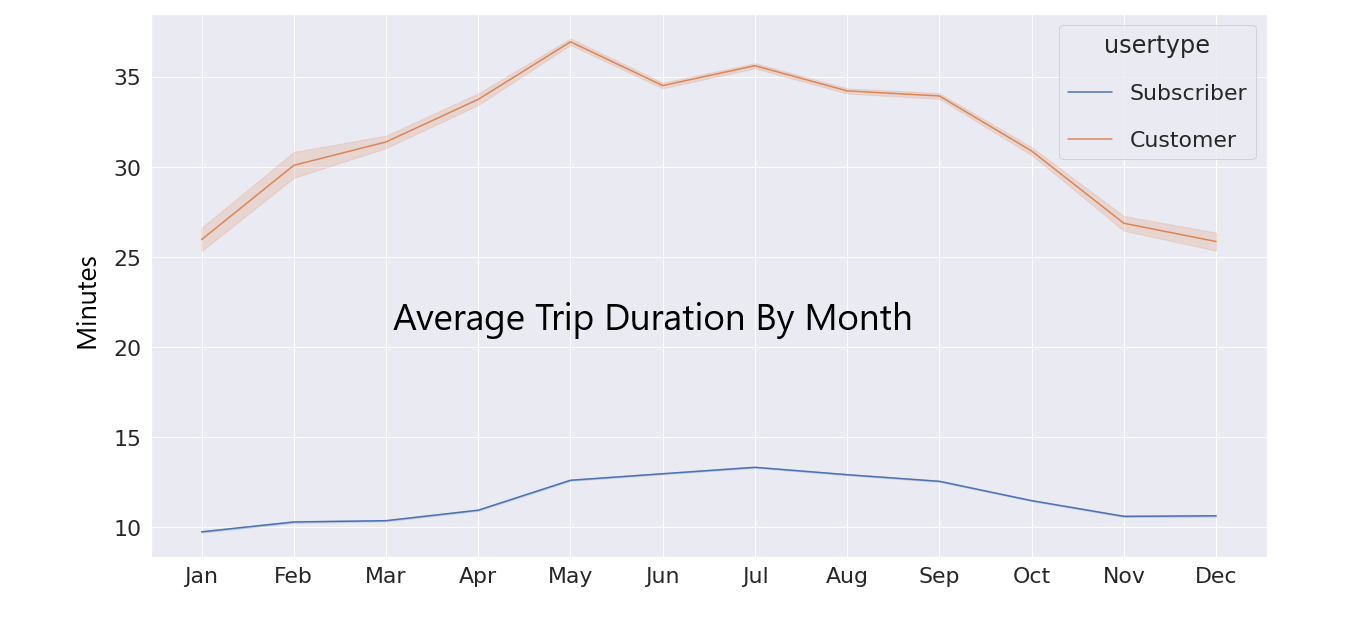
Trip durations tend to increase in the spring and remain relatively high throughout the summer before declining as winter approaches. This pattern is more pronounced for casual users, while subscribers tend to have fairly consistent trip durations year-round.
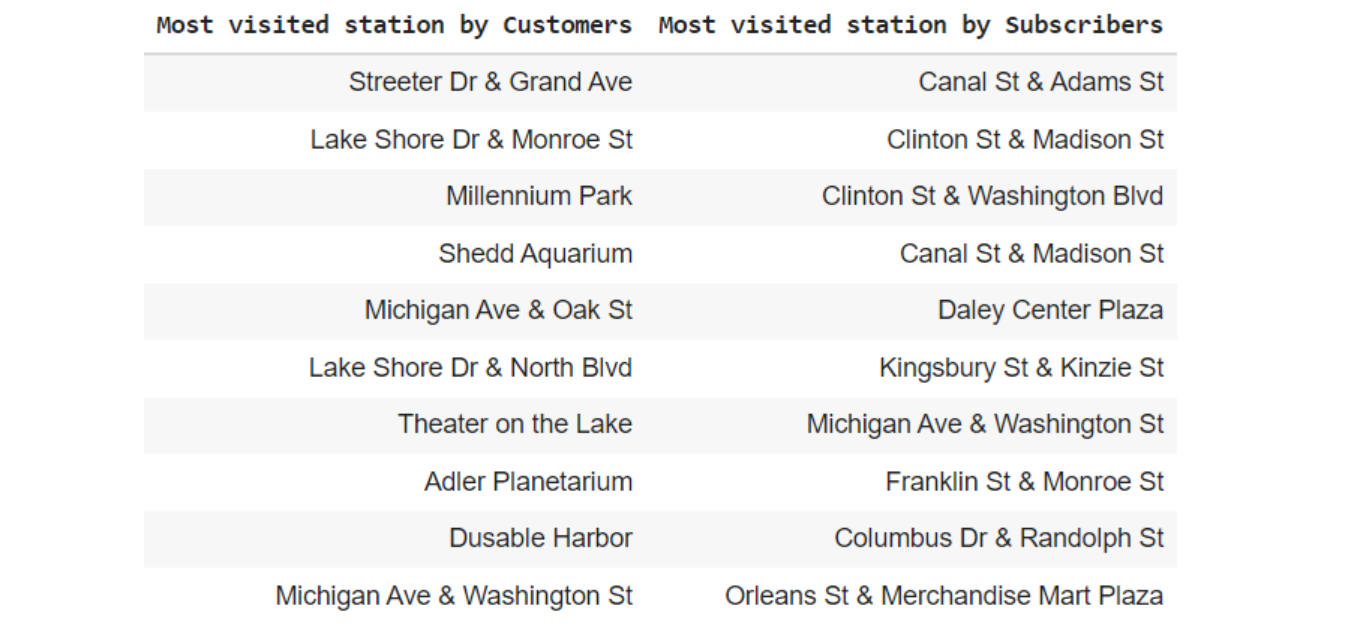
Finally, I created a table listing the top 10 stations most frequently used by both customers and subscribers.
Summary
In a few words, here’s the summary of my analysis:
• Casual riders tend to take longer rides than subscribers.
• Trip durations for casual riders vary widely, while subscribers’ trip lengths are more consistent.
• Both groups ride more frequently on weekends.
• Both ride longer in summer and shorter in winter, with subscribers showing less variation.
• The most popular stations differ between casual riders and subscribers.
Recommendation:
• Based on my analysis, my recommendations are:
• Attract casual riders by adjusting membership pricing to make annual memberships more affordable for those who tend to take longer trips.
• Increase ad campaigns targeting weekends within the app to reach users when they’re most active.
• Offer attractive promotions on annual memberships just before summer starts.
• Display more ads at bike stations frequently used by casual riders to boost membership conversions.