My journey as a maritime data analyst began at Nautilus Labs, a maritime technology startup that leveraged AI-driven analytics to optimize vessel speed, route, and performance, reduce fuel consumption, and minimize emissions for more sustainable and efficient shipping operations. I joined Nautilus in April 2022 as a Voyage Optimization Analyst, and later on, worked as a Senior Maritime Analyst until the company wound down its operation back in November 2023.
The last stage of my hiring process was a take-home assignment that included a simple data analysis and data-driven decision-making task, and a client communication task. I found the assignment very insightful, as it gave me a good understanding of what day-to-day work as a VO analyst at Nautilus may look like.
I completed the assignment and presented my findings with an interview with the hiring manager and a panel of 3 other Nautilus employees. I would like to share my thought process of going through and doing the assignment, the presentation, the feedback, and some interview tips in this post.
Full disclosure - At the time of doing the assignment, there was a Non-Disclosure Agreement not to share any information related to the assignment with the public. But since the company doesn’t exist anymore (not in its original form at least), I hope the NDA is no longer valid, and/or no one is interested in suing me!
Jokes aside, I think the assignment was interesting, and this post will cover various topics, including maritime optimization methodology (in this case - Net Profit Optimization), data analysis, visualization tools and processes, shipping industry client interaction, and many more.
This post is primarily aimed towards young professionals trying to get into maritime tech or any other data-driven industry, but even if you are a seasoned maritime professional or you just have a niche for everything data, client engagement, or AI-driven climate tech, I believe you will find this post both interesting and insightful.
The Assignment:
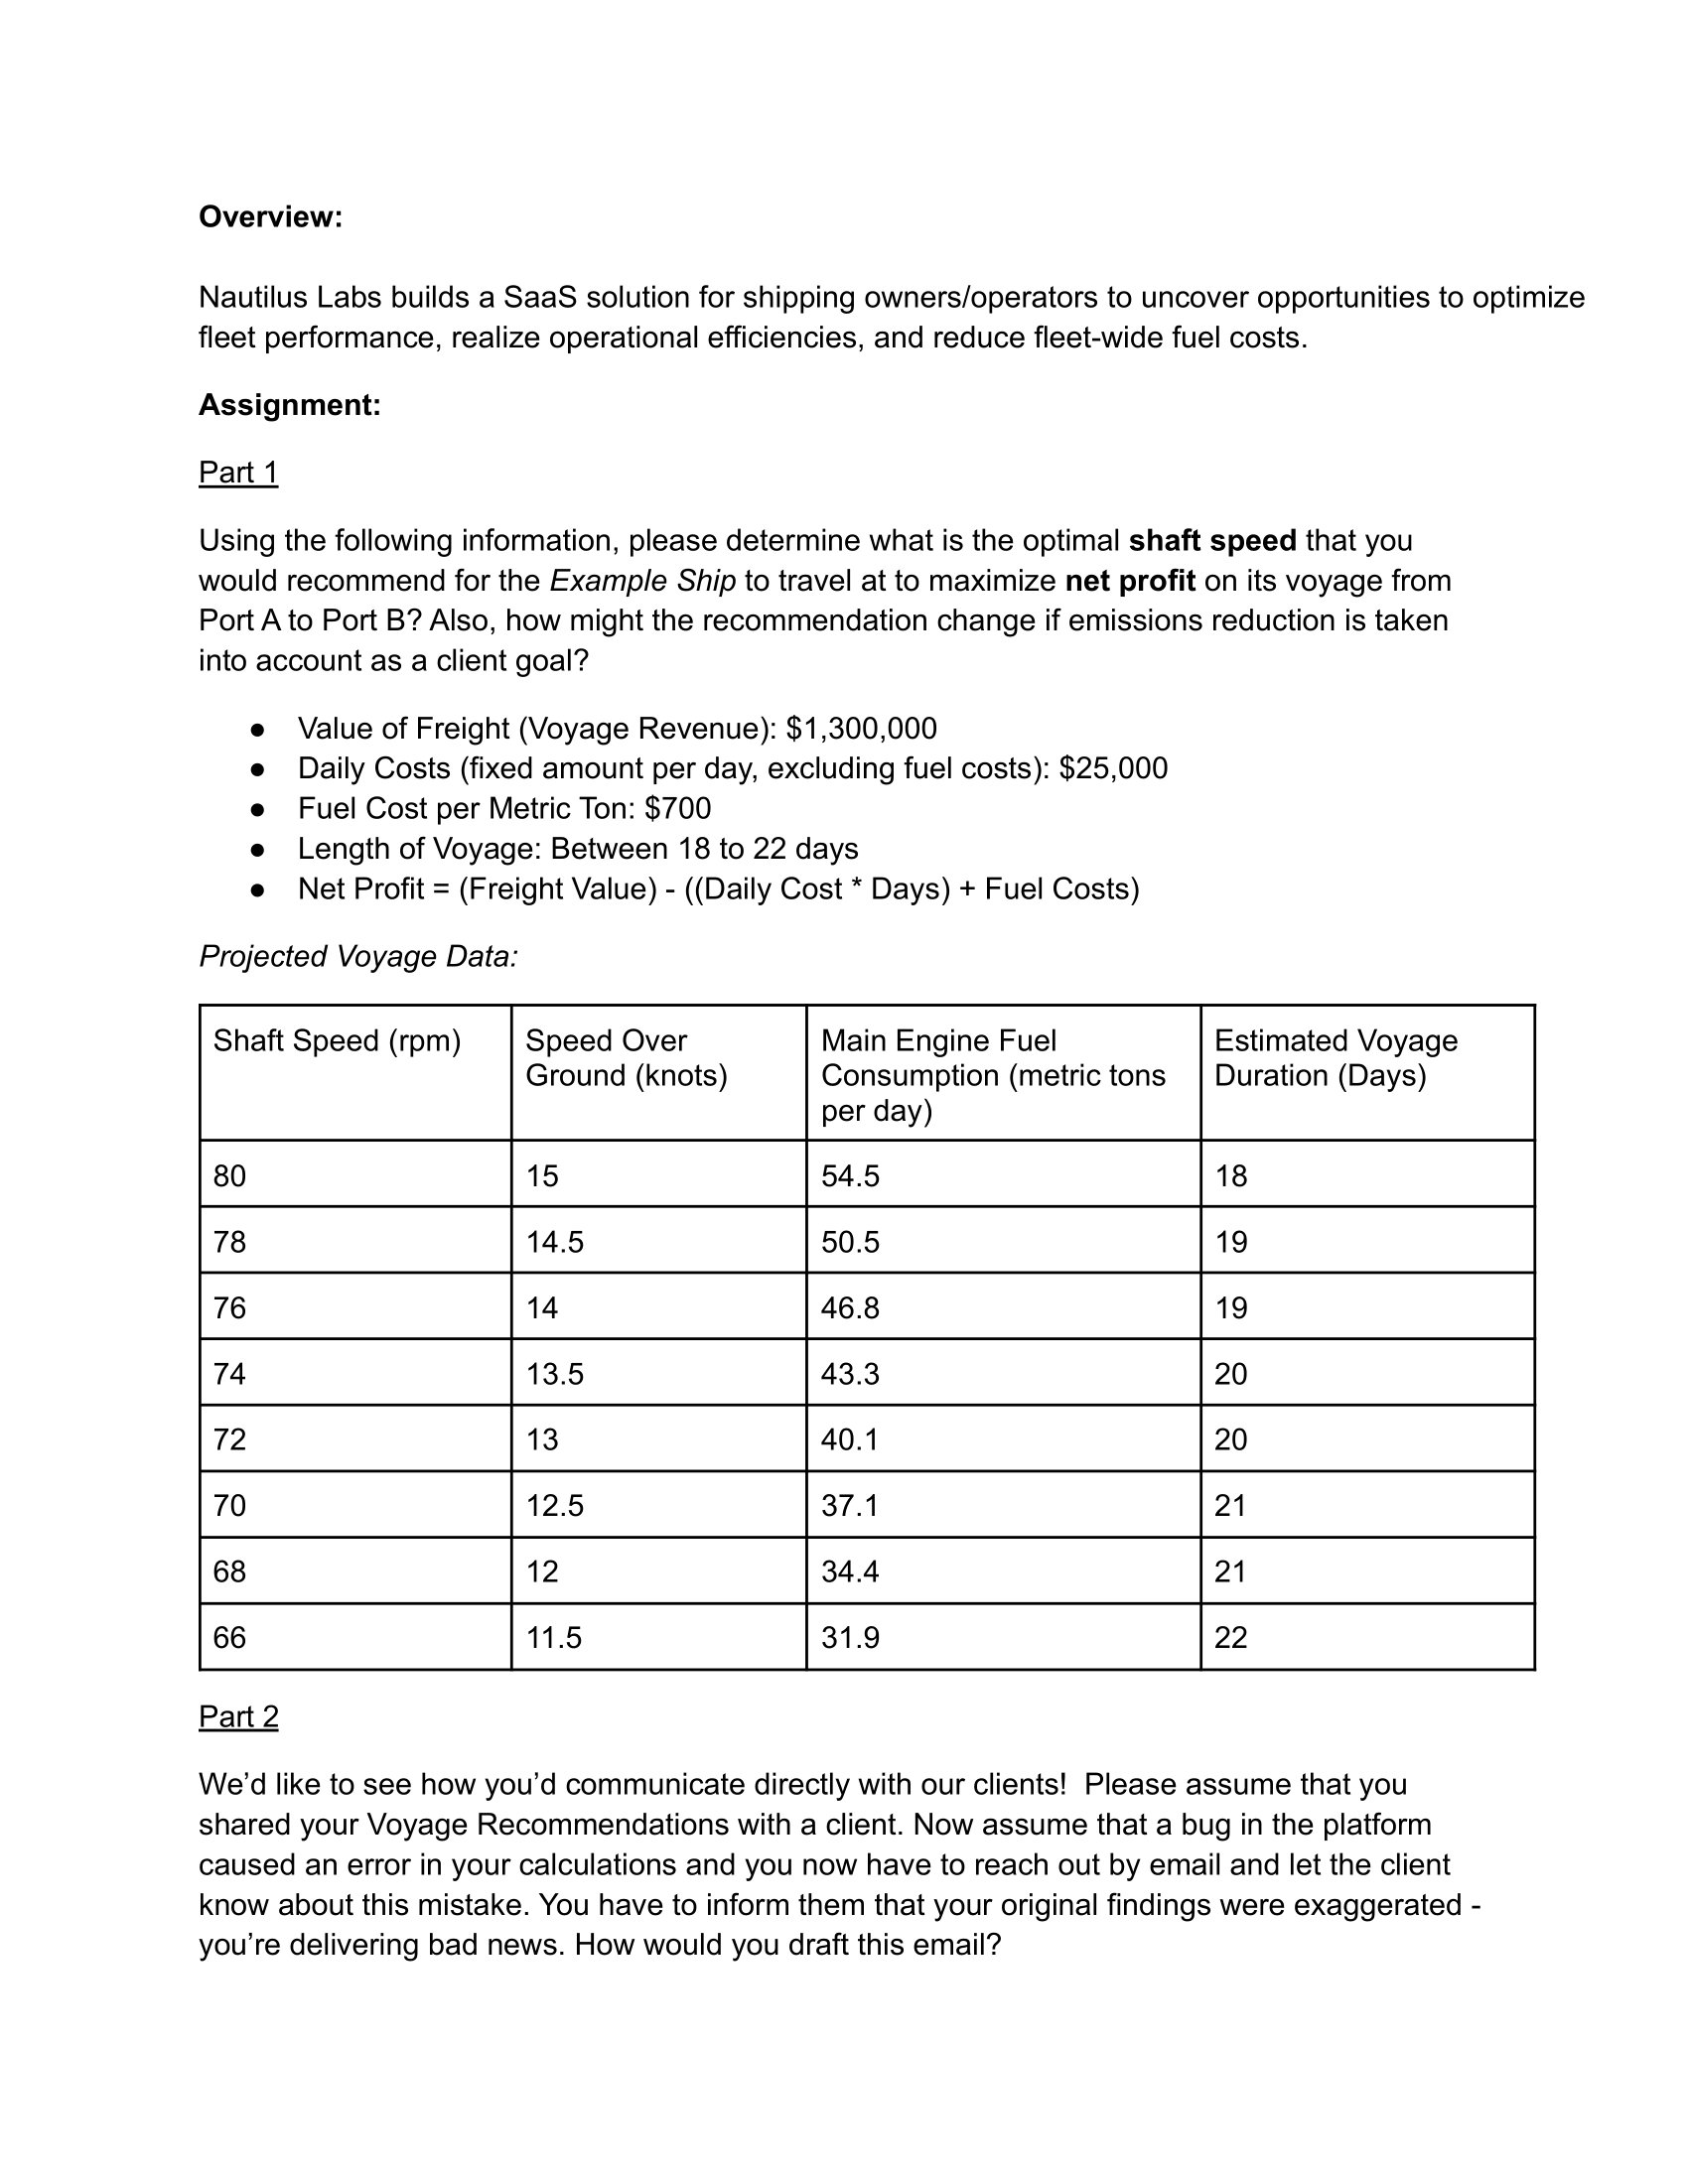
The assignment contained 2 parts. Part 1 was to derive the optimum shaft speed recommendation to maximize the Net profit of an example vessel and voyage (and some other similar optimization goals), utilizing the vessel’s speed and consumption table and voyage duration estimation (more explanation available below). Part 2 contains a task of difficult client communication regarding admitting a mistake and resolving it.
A screenshot of the entire assignment task is provided below:
**Future Ekram here — this post ended up much longer than I originally expected. If you’re looking for a shorter version focused mainly on data analysis and visualization, check out the Jupyter Notebook where the assignment was completed. However, if you have the time and want to take a deep dive into the thought process and methodology, I highly recommend reading the full post!
Part 1 Solution:
Before diving into the solution, let’s add some definition and explanation regarding some terminology used in the assessment. to help understand the task better.
Shaft Speed: The RPM at which the vessel’s propeller shaft is spinning while the vessel is on the go. The propeller shaft is coupled with the ship’s main engine. Shaft speed is directly proportional to the engine(s) rpm. Just like you can drive your car faster by pressing the pedal and increasing engine rpm, sacrificing fuel efficiency and vice versa, you can also increase a vessel’s speed by increasing the shaft speed at the expense of higher fuel cost and emissions.
Freight Value: In maritime transportation, the freight value refers to the price charged by a carrier for transporting goods by sea. This price, often referred to as a freight rate or freight charge, is determined by various factors, including the cargo’s characteristics, the distance of the voyage, and the specific route.
Net Profit: In maritime transportation, net profit for a voyage refers to the total profit earned from a specific shipping voyage after accounting for all relevant revenues and expenses associated with that voyage.
Net Profit (Voyage) = Voyage Revenue – Voyage Expenses
Source of Voyage Revenue: Freight Value
Source of Voyage Expenses: Fuel Cost, Port Cost, Miscellaneous Costs (Ship maintenance, crew salary, provisions, etc.)
Speed Over Ground: Speed over ground (SOG) is the actual speed at which a vessel moves relative to the Earth’s surface, typically measured using GPS. The unit of SOG is Nautical Miles Per Hour or “Knots” (1 Nautical Mile = 1.852 kilometers per hour (km/h) = 1.15078 miles per hour (mph))
Now that we have more context regarding some of the terminologies used in the assignment, let’s dive deep into it and explain how I solved it.
Tools I Used:
If your goal is to simply find the answer to the question asked in this assignment, which is to identify the ideal shaft speed for maximizing net profit, you can use any commonly used spreadsheet program, like Excel or Google Sheets, or simply use pen and paper and get it done. But the goal of these kinds of assignments is not just to see if you can find the answer, it’s also how you find it, i.e, your entire thought process of understanding the problem, finding a way to solve it that’s not only accurate but also efficient and repeatable. Also, they want to see if you understand the problem and your solution enough that you can explain it to both technical and non-technical audiences.
This is why, instead of using Excel and PowerPoint, I decided to do the project in a Jupyter Notebook Google Colab, a free, cloud-based tool from Google that lets you write and execute code for cleaning, analyzing, and visualizing data, and document the analysis in a single, shareable document.
In Google Colab, I used Python for the project, as Python is a simple, beginner-friendly language that also has various analytics-focused libraries, which makes data analysis efficient, robust, and scalable. I primarily used Pandas and Numpy for feature engineering, data cleaning, and data analysis, and Plotly for generating interactive visualizations.
Preparing the Data:
Since the dataset was given to me in a PDF, and not in a spreadsheet (Excel or CSV format). I decided to copy the data from the speed and consumption table manually and create a pandas dataframe. While it is possible to parse the PDF to extract data automatically using some other Python libraries, I thought I should not shift my focus to data parsing, as that is not the main focus of the project. Plus, doing some manual work makes it simpler and less prone to error.
Calculation:
Let’s look at the Net Profit equation one more time:
Net Profit = (Freight Value) - ((Daily Cost * Days) + Fuel Costs)
For a given voyage, assume there are no major changes in Voyage, Cargo Plan, and Bunker Price, the Freight Value, Estimated Daily Cost, and Fuel Cost Per Metric Tons (MT) should remain the same. Which we can also see in the information given to us, where the Freight Value is $1,300,000, the Daily cost is $25,000, and the Fuel Cost is $700/MT.
So you might be wondering, if every cost is the same, then how can we optimize the voyage to maximize profit? Well, if you look closely, you will realize that although the Daily cost is constant, the total daily costs for the voyage will vary, based on how many days the vessel sailed for that voyage. And how many days the vessel would be sailing depends on the vessel’s speed.
Also, although the fuel cost per metric ton is consistent, the daily fuel cost will vary, and if the daily fuel consumption varies, the overall fuel cost will vary.
If you remember the shaft speed definition I provided earlier, you’d know that increasing the vessel’s shaft speed will increase the vessel’s speed, which will decrease the vessel’s sailing days as the vessel will reach port earlier, which would reduce the total daily cost, and would contribute towards increasing net profit. On the other hand, increasing the vessel’s shaft speed would increase the vessel’s main engine fuel consumption, which would increase the total fuel cost and contribute to decreasing net profit. And the opposites are true for decreasing shaft speed.
So, what we can see is that whether you increase or decrease shaft speed, the two variables (daily cost and fuel cost) would have an opposing impact on net profit. So we need to identify the sweet spot where the overall Net profit is the highest after considering all the variable costs.
Action Items:
• Create a dataset using the data provided
• Calculate the Net Profit for each shaft speed, utilizing the given net profit equation and variable values (daily cost, fuel cost, etc.)
• Identify the Shaft Speed that corresponds with maximum net profit
• Visualize the Net Profit Trend with shaft speed and highlight the shaft speed with maximum Net profit
Code:
Now that we fully understand the problem and how to solve it, coding it up should be very easy
Create a dataset in pandas:
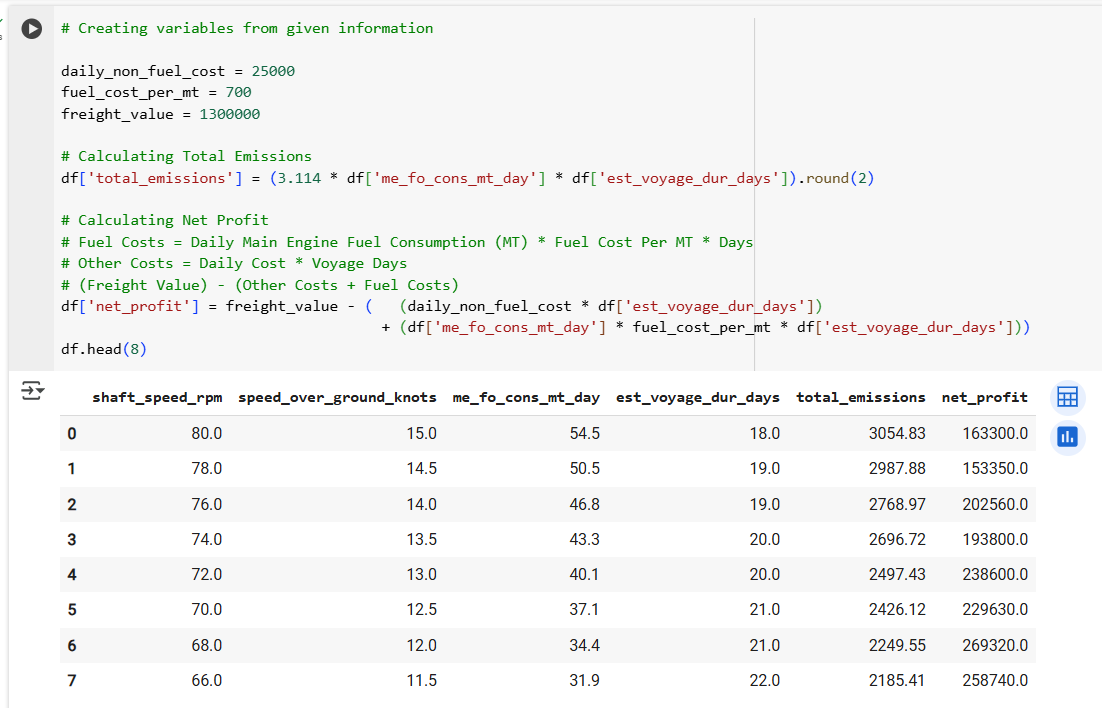
Create Variables for Freight Value, Fuel Cost, and Daily Cost, and Create a Net Profit Column:
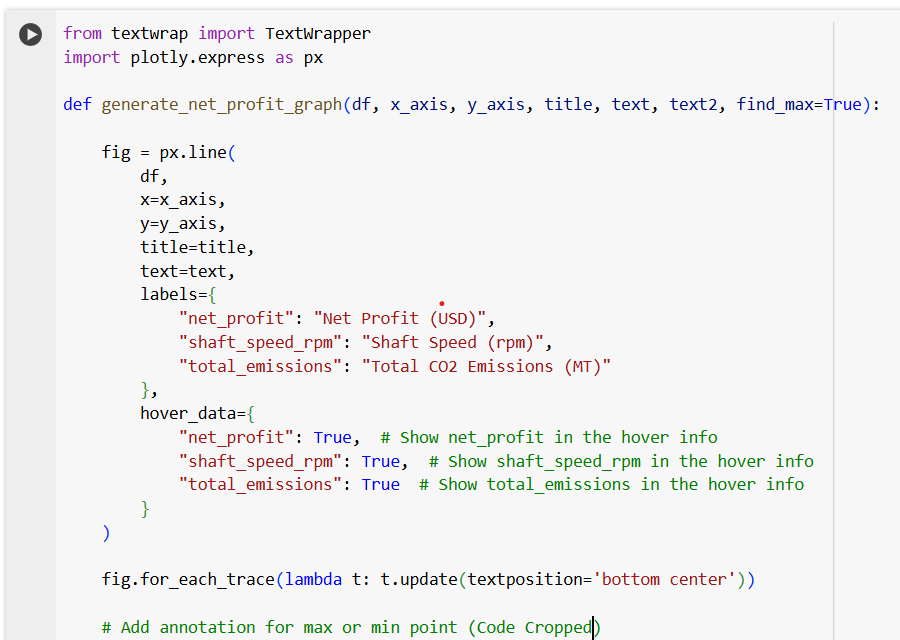
Create a Function to Visualize a Line Graph:
Visualize the Findings:
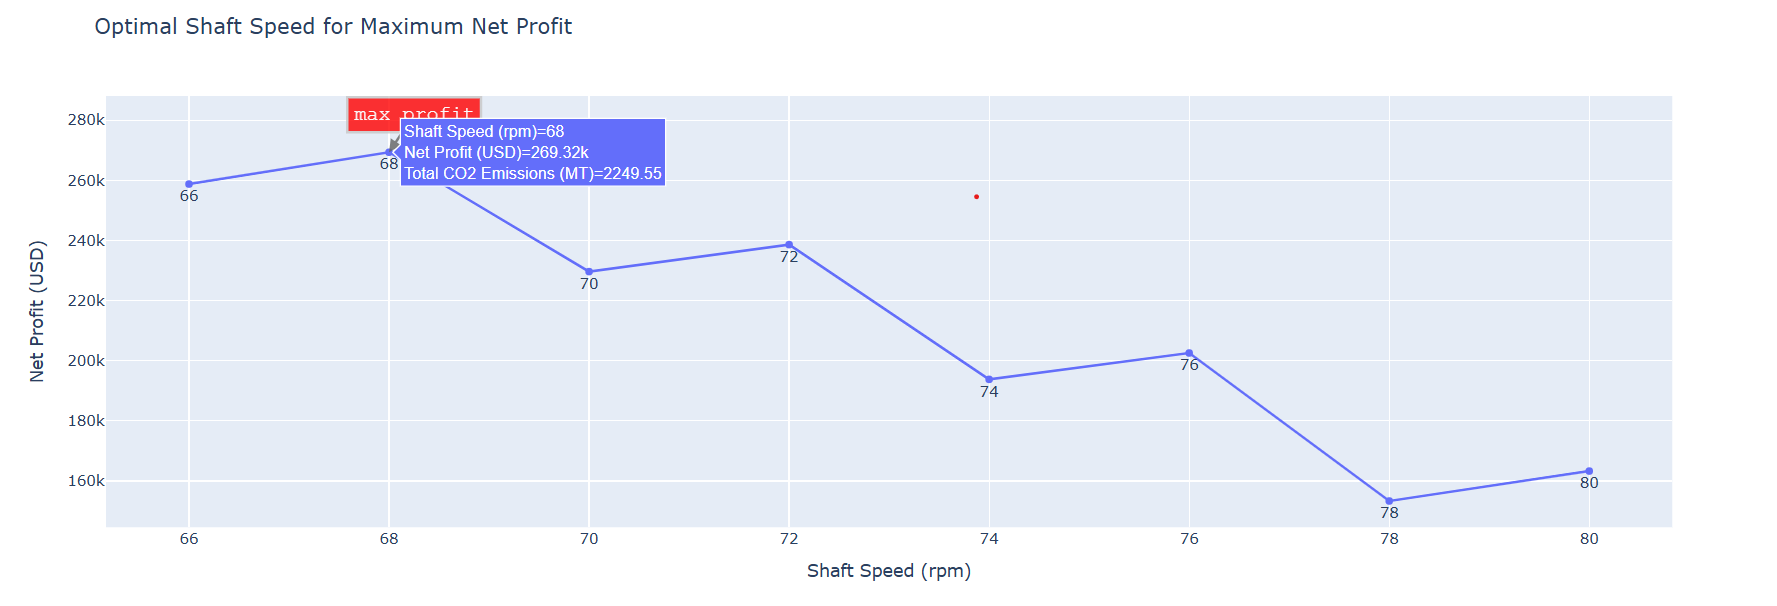
So, from our analysis, we can see that the shaft speed for maximizing net profit is 68 rpm. We have officially solved the problem!
But wait, there’s more!
Although we have solved the main problem, there was an additional question - “And also, how might the recommendation change if emission reduction is taken into account as a client goal?”
Well, this question is less specific and gives us the opportunity to think. I think that the recommendation would change based on what our client’s emission reduction goal exactly is. Once we know that, we can change our recommendation.
When thinking about the emission reduction goal, I could think of three different types of goals.
• Minimize emissions for the voyage, regardless of net profit.
• Maximize net profit while keeping emissions under a certain threshold.
• Adding some emission penalty in the equation and then doing the calculation to identify the shaft speed to maximize net profit with considering the added cost.
Before we do any emission analysis, let’s create a new column for emission, which is derived from the main engine fuel consumption. To do that, we need to know the carbon intensity of the fuel oil used. Since the fuel type and carbon intensity data were not provided to us, let’s assume that the vessel is using Heavy Fuel Oil (HFO) and the Carbon intensity of the fuel is 3.114 MT CO2 / MT HFO. While the carbon intensity of fuel can vary based on fuel composition, energy content (calorific value), and engine efficiency, the variation is fairly narrow, and the number we chose would be very close in most situations.
Carbon intensity of HFO = 3.114 MT CO2 / MT HFO
Total Emission = (Main Engine Fuel Consumption × Carbon Intensity of HFO) × Voyage Days
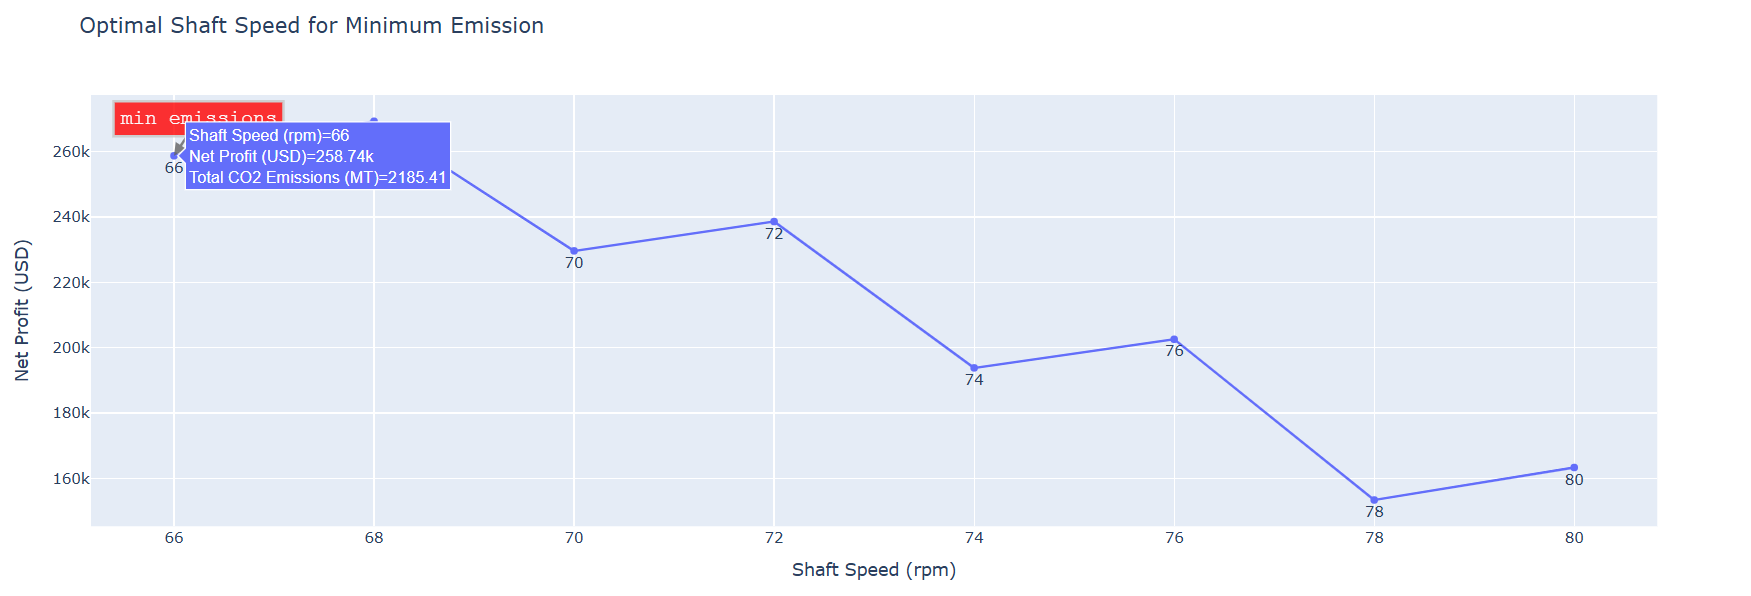
Minimize Emissions for the Voyage, Regardless of Net Profit.
Now that we have the total emission for different shaft speeds, it’s super easy to identify the shaft speed that corresponds with the minimum emission.
We can see that the emission is minimum at the minimum shaft speed of 66. Which is expected, as minimizing shaft speed should minimize fuel consumption, hence minimize emissions.
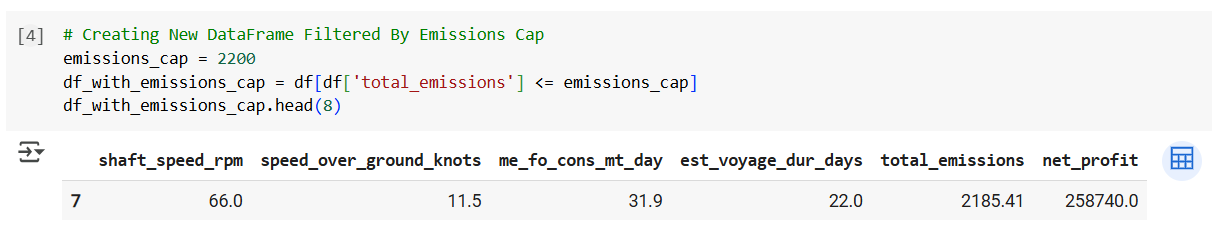
Maximize Net Profit While Keeping Emissions Under a Certain Threshold
Let’s assume the emission threshold for this voyage, set by the client, is 2,000 MT. Considering this cap, we can filter out the shaft speeds that exceed that number and then identify the shaft speed that maximizes net profit is 66 rpm.
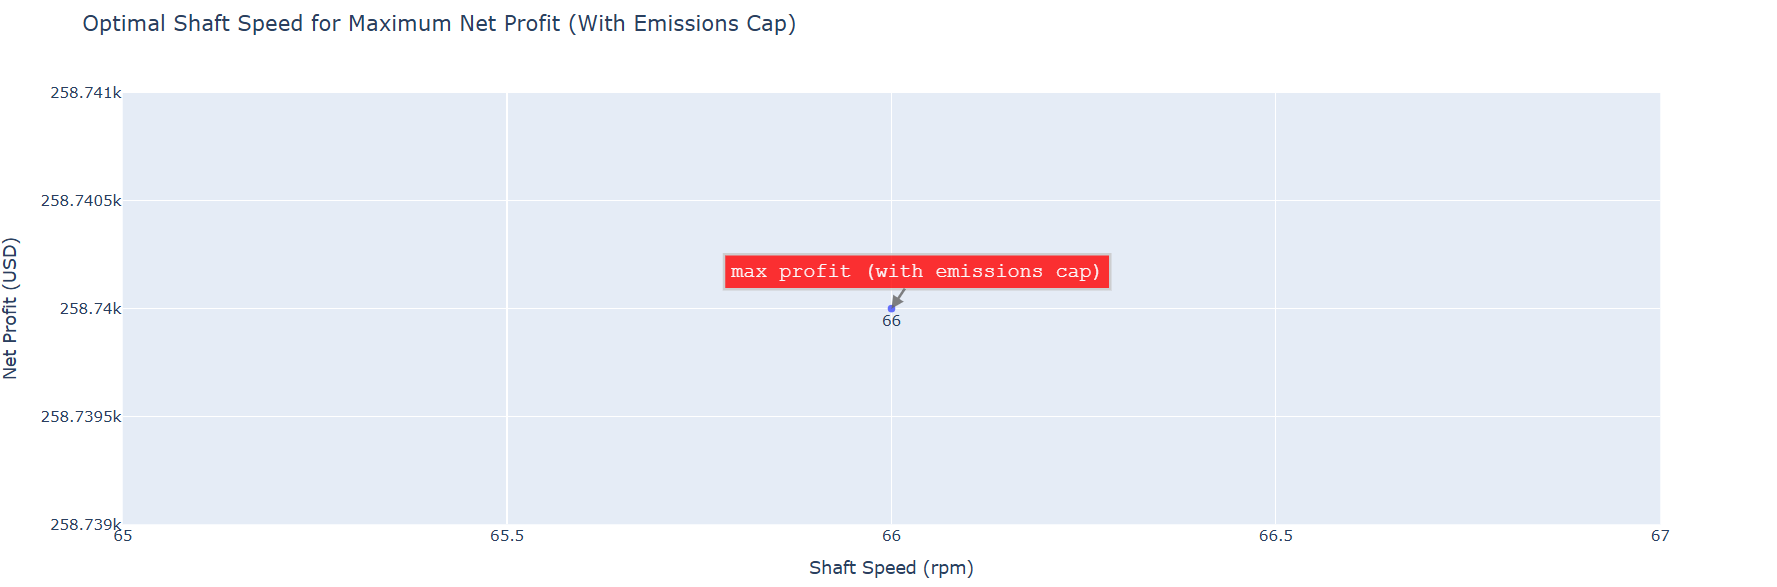
We can see that with the emission cap, the optimum shaft speed for maximizing Net Profit is - 66 rpm
Maximize Net Profit with Added Emission Penalty:
Adding that emissions penalty in the equation and then doing the calculation to identify the shaft speed to maximize net profit with considering the added cost. Let’s add an emission penalty in the net profit equation
Net Profit = (Freight Value) - ((Daily Cost * Days) + Fuel Costs) - (Total Emissions × Emission Penalty)
Let’s say that the emission penalty is $10/MT CO2.
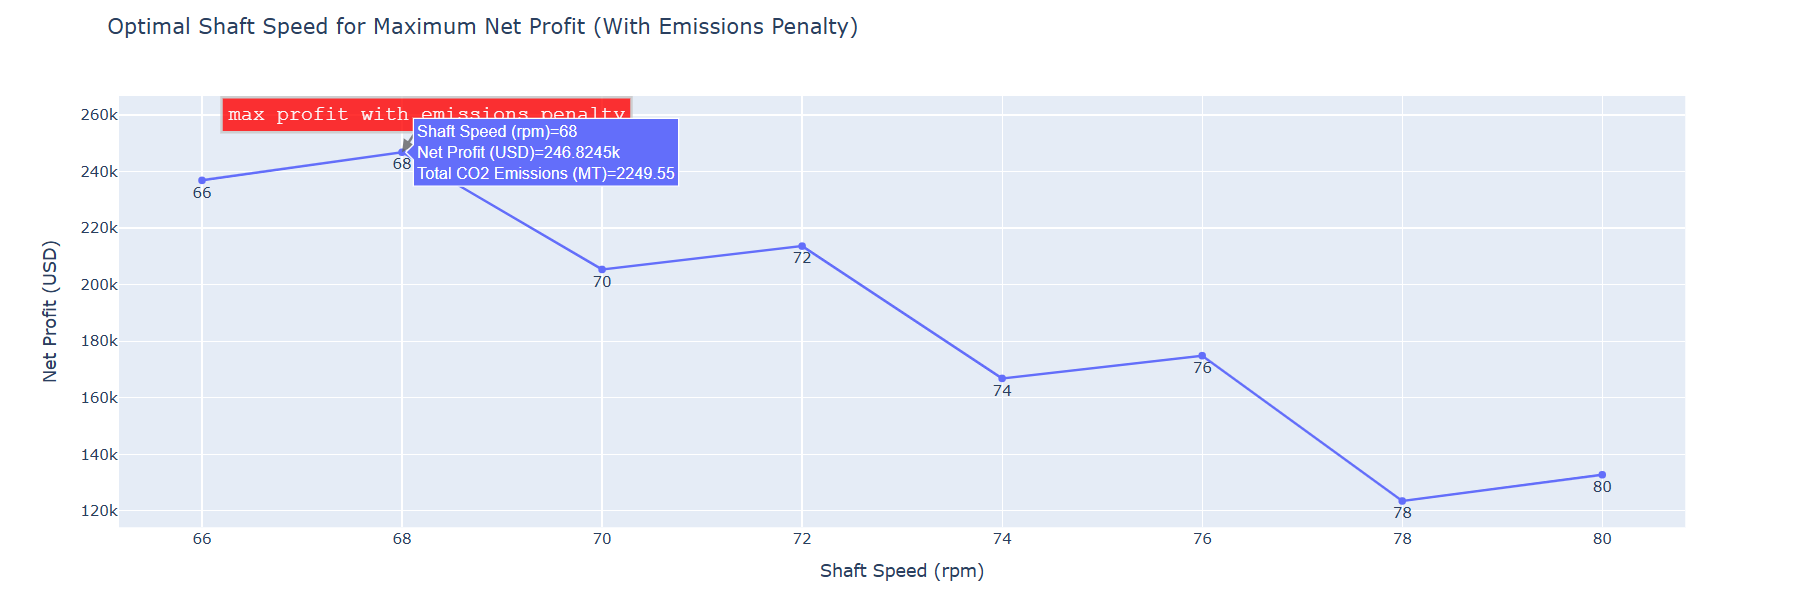
Adding that variable, we can identify the shaft speed that maximizes Net Profit
So, after adding the emission penalty, the shaft speed of 68 results in maximizing Net Profit
Final Suggestions:
Based on the analysis, my final recommendation to the client would be:
• If the goal is to maximize profit, 68 rpm would be ideal.
• If the goal is to minimize emissions, 66 rpm would be ideal.
• If the goal is to maximize profit with an emissions cap of 2200 MT CO2, 66 rpm would be ideal.
• If the goal is to maximize profit by adding a 10$/MT CO2 emissions penalty, 68 rpm would be ideal.
Presentation Tips from Both Sides of the Table:
After completing my data analysis, data visualization, and data-driven decision-making tasks, I had to present my work to a panel of four Nautilus employees. This was the final stage of the interview process and lasted about 30 minutes. During the session, I walked them through how I approached the questions, the methods I used, and the reasoning behind my decisions. The experience was surprisingly conversational—it wasn’t the typical grilling you might expect. Instead of trying to catch me off guard with tricky questions, the panel was more interested in understanding my thought process and how I tackled problems. I even had the chance to ask them questions about their perspectives on different parts of the process, which sparked some insightful discussions.
Before diving into the tips, it’s worth mentioning that a year after joining Nautilus, I was promoted to Senior Maritime Analyst and had the opportunity to sit on the other side of the table. I joined the interview panels and helped make hiring decisions for two new analysts. That means the advice I’m sharing comes from both an interviewee’s and an interviewer’s perspective—what makes a presentation compelling, what draws interviewers in, and what makes someone truly stand out.
1. Understand the Goal of the Presentation
These types of interviews are not about impressing clients or selling a product—they’re about selling yourself. Your goal is to showcase how you think, not just what you found. The interviewers already know the correct answers; they’re assessing whether your approach, mindset, and methodology would be a valuable addition to their team.
So, rather than focusing only on the outcome, emphasize your:
• Thought process
• Analytical methods
• Workflow design
• Communication skills
• Adaptability and self-awareness
This is your chance to show what it would be like to work with you, especially in real project scenarios.
2. Research the Company Thoroughly
This might be the single most underrated tip: do your homework. Learn about the company’s mission, products, industry positioning, and values. Watch their product demos, read their blog or press releases, follow their social media, and try to understand what challenges they’re solving.
Doing this shows genuine interest and allows you to:
• Align your experience with their goals
• Ask thoughtful, specific questions
• Demonstrate cultural fit and motivation
Interviewers are impressed when candidates clearly care about the company—not just the job.
3. Don’t Be Afraid to Stand Out
In competitive interviews, being “qualified” often isn’t enough. Many candidates will have similar skills and experiences. What sets you apart is how memorable you are. Leave a positive impression—not by being flashy, but by being authentic, confident, and personable.
For example, if you make the panel smile, ask an unusually insightful question, or show a unique perspective, that could be the thing they remember when making a decision. Interview panels are human. People tend to root for those they feel connected to.
4. Treat the Interview as a Two-Way Conversation
While most questions will come from the panel, don’t miss your chance to ask back. Thoughtful questions not only show your curiosity—they show that you’re taking the opportunity seriously.
Too often, candidates freeze up when asked, “Do you have any questions for us?” If you say no—or worse, don’t prepare any—that can signal a lack of engagement. Even if the rest of your interview went well, someone else who asked smart questions could end up with the edge.
Here’s how to avoid that:
• Ask questions naturally throughout the interview, when appropriate.
• Prepare a list of potential questions ahead of time so you’re not caught off guard.
• Focus on the company’s culture, team structure, tools, workflows, or future direction—these show you’re thinking about what it would be like to work there.
And remember: You’re also interviewing them. You have every right to evaluate whether their values, work environment, and projects align with what you’re looking for. Asking the right questions is a sign of professionalism—not arrogance.
A Few Key Moments from My Presentation
For my interview presentation, I made a bold decision: I didn’t use a PowerPoint at all. That might sound risky—and in some ways, it was—but I had a clear reason. The goal of the presentation wasn’t to impress with polished slides. It was to demonstrate how I think, how I work, and how I solve problems. And I realized that the best way to show that wasn’t through static snapshots—it was through the Jupyter Notebook I used to complete the assignment.
So, instead of slides, I walked the interview panel through my actual notebook. It allowed them to see my process from start to finish: the data cleaning, exploration, visualization, and analysis. They could hear my reasoning and see it play out step by step, in real time. It felt more authentic and transparent.
What happened next validated my choice. One of the interviewers—who later became my manager—told me that they also use Jupyter Notebooks to generate counterfactual reports for clients. They mentioned that my ability to build automated and reusable analysis workflows would be directly applicable to the role. That moment made it clear: the tool I chose and how I used it made a bigger impact than the actual results of the analysis.
Interestingly, they also mentioned that most candidates complete the assignment in Excel. When I asked why, they explained that Excel is familiar and easy to use. I shared my perspective—that while I could have done it in Excel, Jupyter makes the analysis more transparent, reproducible, and scalable—and they agreed. It sparked a short but meaningful discussion about workflows and tooling.
One of the questions I asked during the interview was whether the assignment resembled tasks I’d be working on if hired. They explained that while the data provided was synthetic, it closely resembled high-frequency sensor data and noon reports from vessels, which analysts at Nautilus work with regularly. Asking this showed that I was already thinking ahead—about the real-world context, the data sources, and how I’d fit into the role.
Sometimes, doing things a little differently can set you apart in a powerful way—especially when it’s done with intention, clarity, and confidence.
Final Thoughts
Presenting in an interview can be nerve-wracking, but it’s also one of the few chances you get to truly stand out. By focusing on your process, doing your research, engaging in meaningful dialogue, and bringing your authentic self, you give yourself the best shot at not only impressing your interviewers—but connecting with them.
Good luck—and own your story.
**Part 2 of the assignment coming soon……..