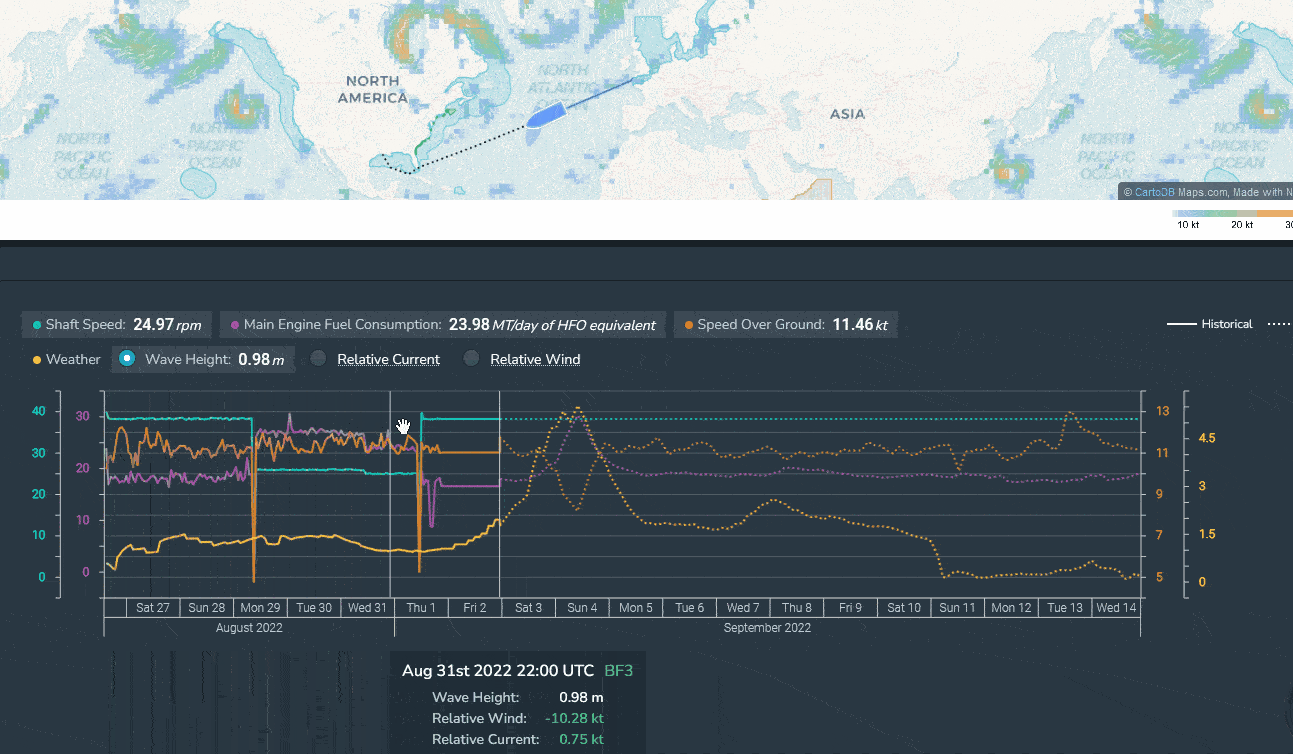
Model accuracy was one of the most critical pillars of the Voyage Optimization (VO) service. Every recommendation and predicted performance metric depended on the underlying speed and fuel consumption models. If those models were inaccurate, the resulting recommendations could be suboptimal, misleading, or even counterproductive.
Model accuracy was primarily influenced by two factors: data quality and data recency. If the input data was incorrect or the model had not been trained on recent operational data, prediction errors would quickly emerge. To verify a vessel’s model accuracy, the existing process involved manually checking the latest observed speed and fuel consumption data in the platform and comparing it against the model’s first predicted values. If the difference was within a 2% threshold, the model was considered accurate. Otherwise, the data science team would be contacted to investigate and retrain the model if necessary.
While this approach was quick and simple, it was not particularly robust. A mismatch between the last observed data point and the first predicted value could easily be a temporary anomaly rather than evidence of a consistently inaccurate model. To truly assess accuracy, the model needed to be evaluated across multiple points in time to determine whether errors were persistent or isolated.
Although such an evaluation was technically possible, doing it manually was extremely time-consuming and impractical at scale. Recognizing this limitation, I decided to automate the model accuracy assessment process to create a standardized, reliable, and scalable method for measuring prediction performance.
Working Principle
The automated accuracy assessment followed a structured and repeatable workflow:
-
The user specifies a vessel and a time range for the accuracy evaluation.
-
For each hour within the selected time range, the notebook runs a simulation and collects:
- The last observed values of speed over ground (SOG) and main engine fuel consumption (MEFC)
- The first predicted values from the simulation
-
Predicted and actual SOG are plotted against shaft speed to visually assess alignment over time.
-
The hourly difference between predicted and actual SOG is calculated and plotted to highlight how accuracy fluctuates throughout the time window.
-
The same visualizations and calculations are generated for main engine fuel consumption.
- Key statistical accuracy metrics are computed, including:
- Average error
- Average error percentage
- Mean Squared Error (MSE)
- Root Mean Squared Error (RMSE)
- Mean Absolute Error (MAE)
- R² score
- All metrics and visualizations are compiled into a standardized PDF report.
Design
Following the same design philosophy as the Voyage Optimization PDF, I created a concise two-page report that captured all essential accuracy information. The goal was for users to generate the report with minimal effort and quickly understand the health of a vessel’s predictive models at a glance.
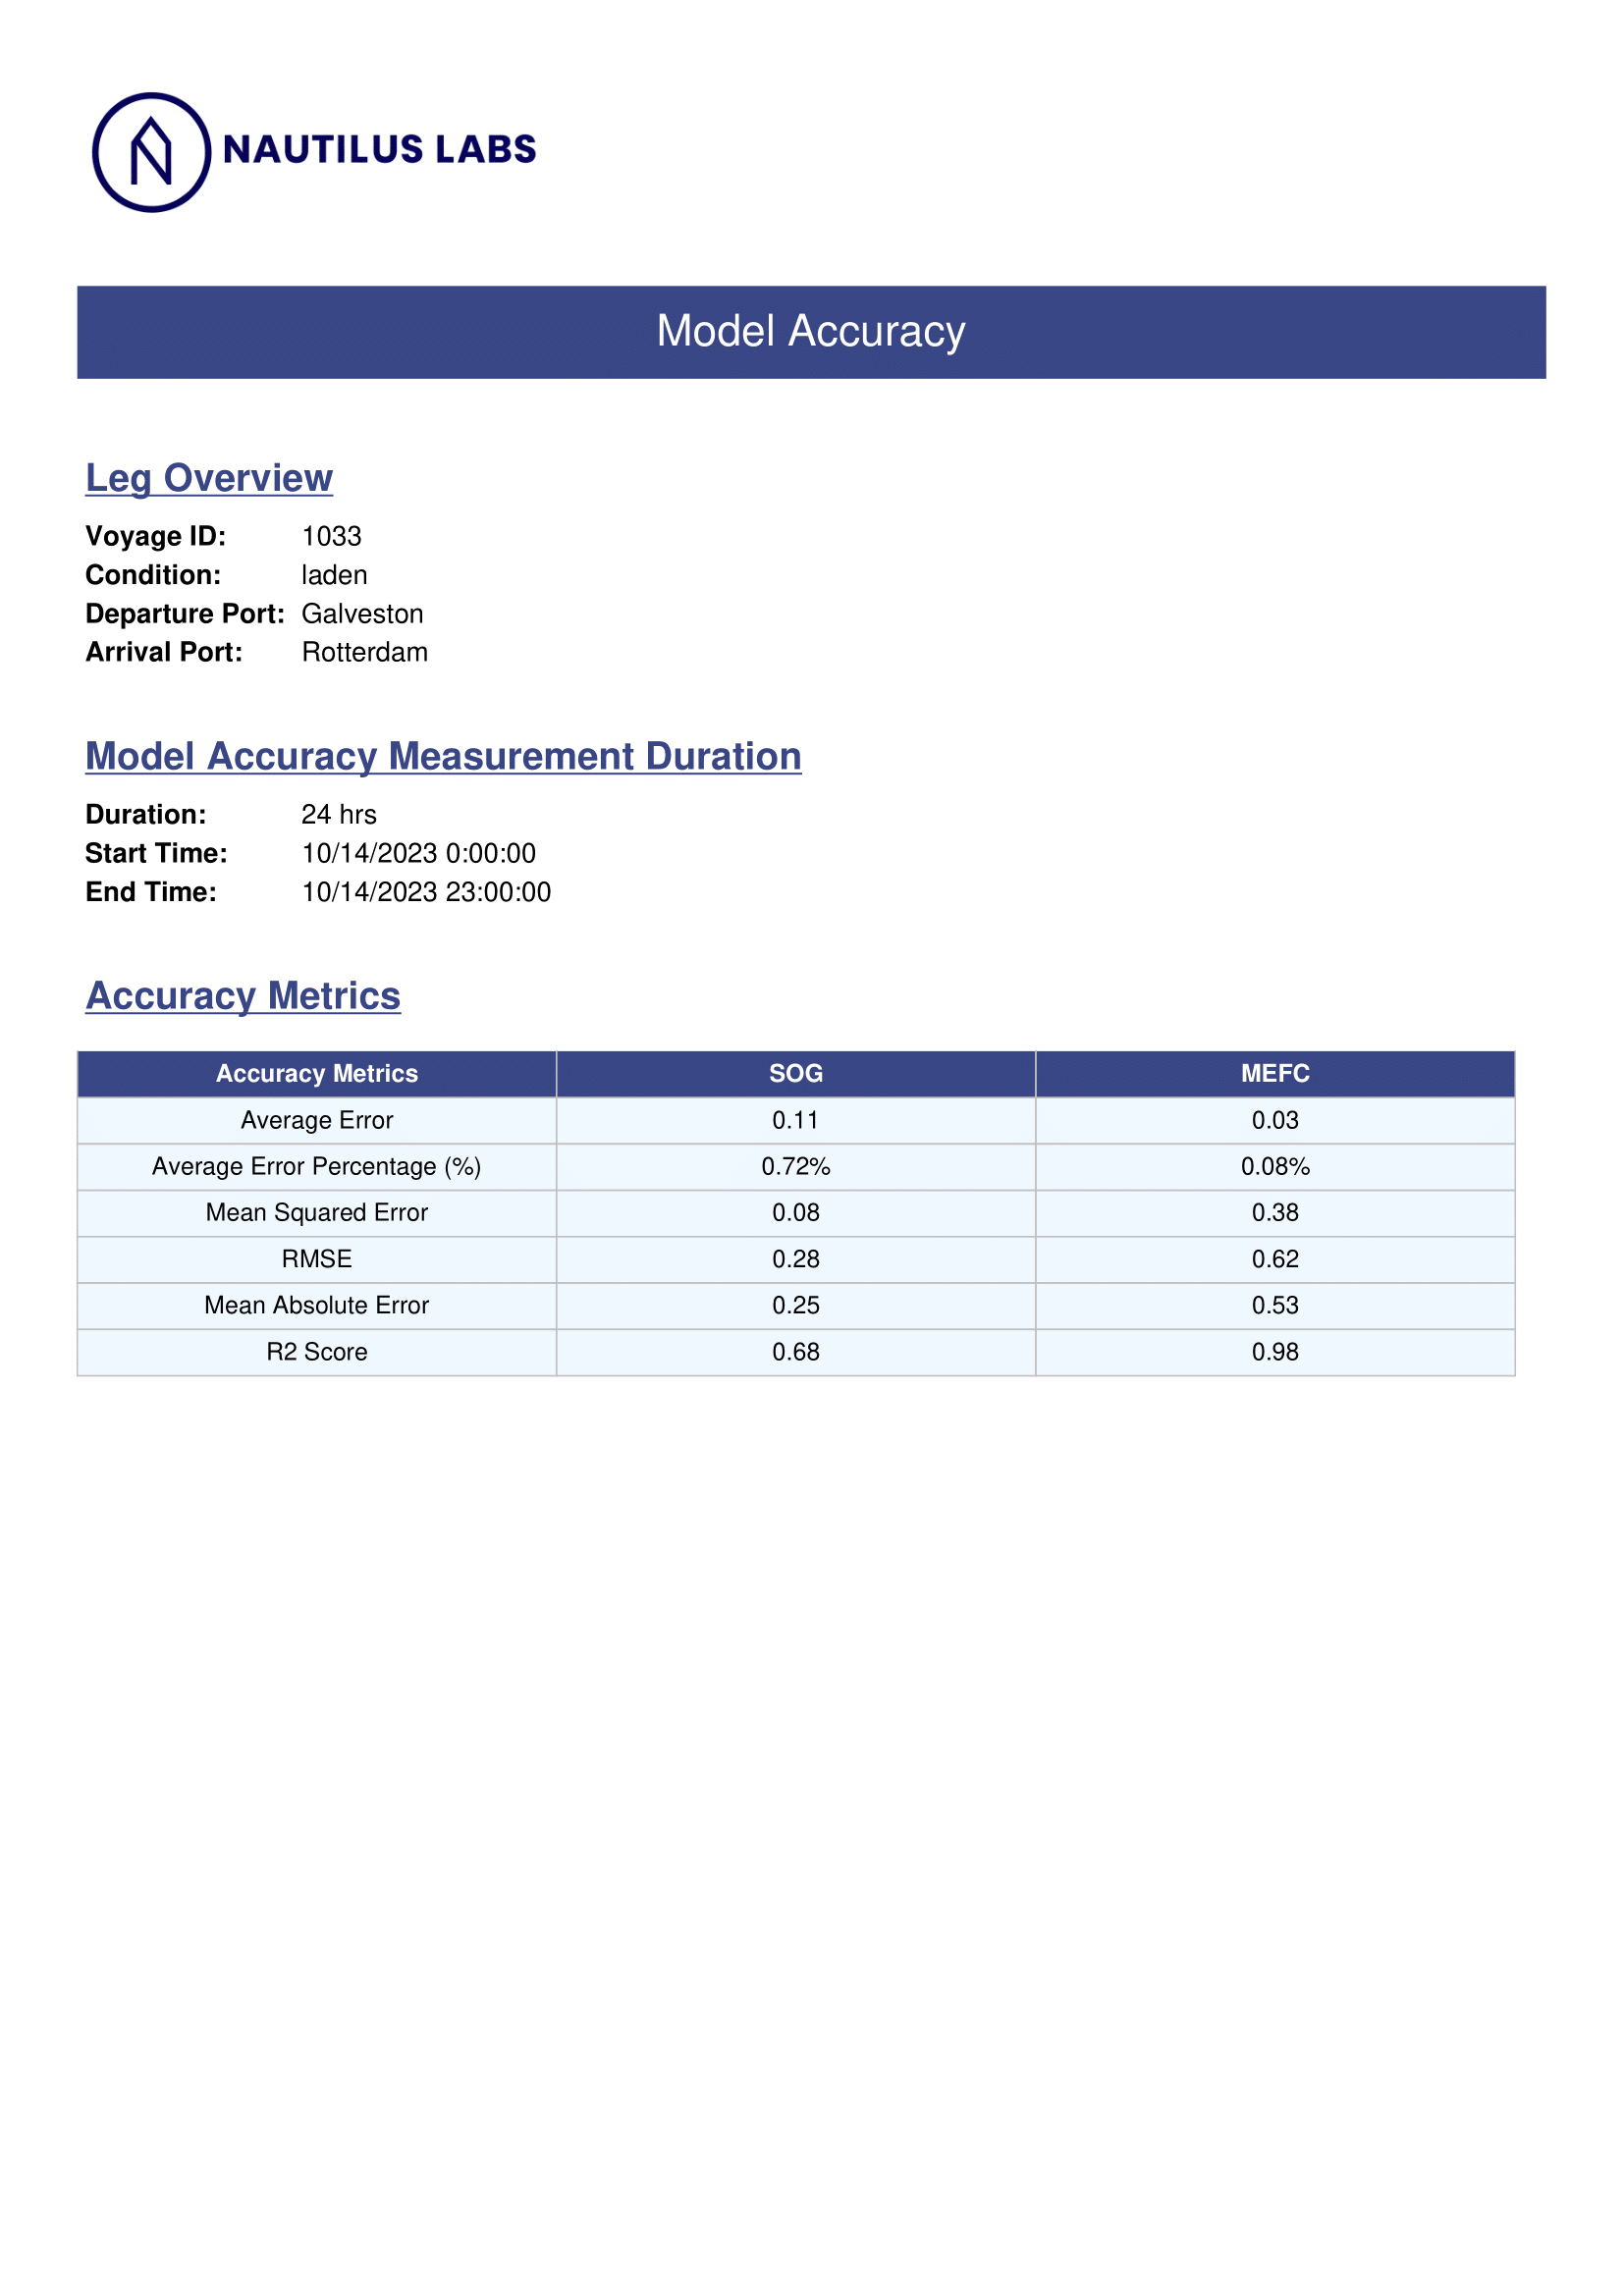
Page 1
The first page presents high-level context and quantitative metrics. It includes vessel metadata, the selected accuracy evaluation time range, and a table summarizing key accuracy statistics such as RMSE and R². This page allows users to immediately identify the vessel, understand the evaluation period, and assess model performance using standardized metrics.
Page 2
The second page focuses on visualization. It includes:
- Time-series plots comparing predicted and actual values for both speed over ground and main engine fuel consumption
- Plots showing how prediction error fluctuated over time for each metric
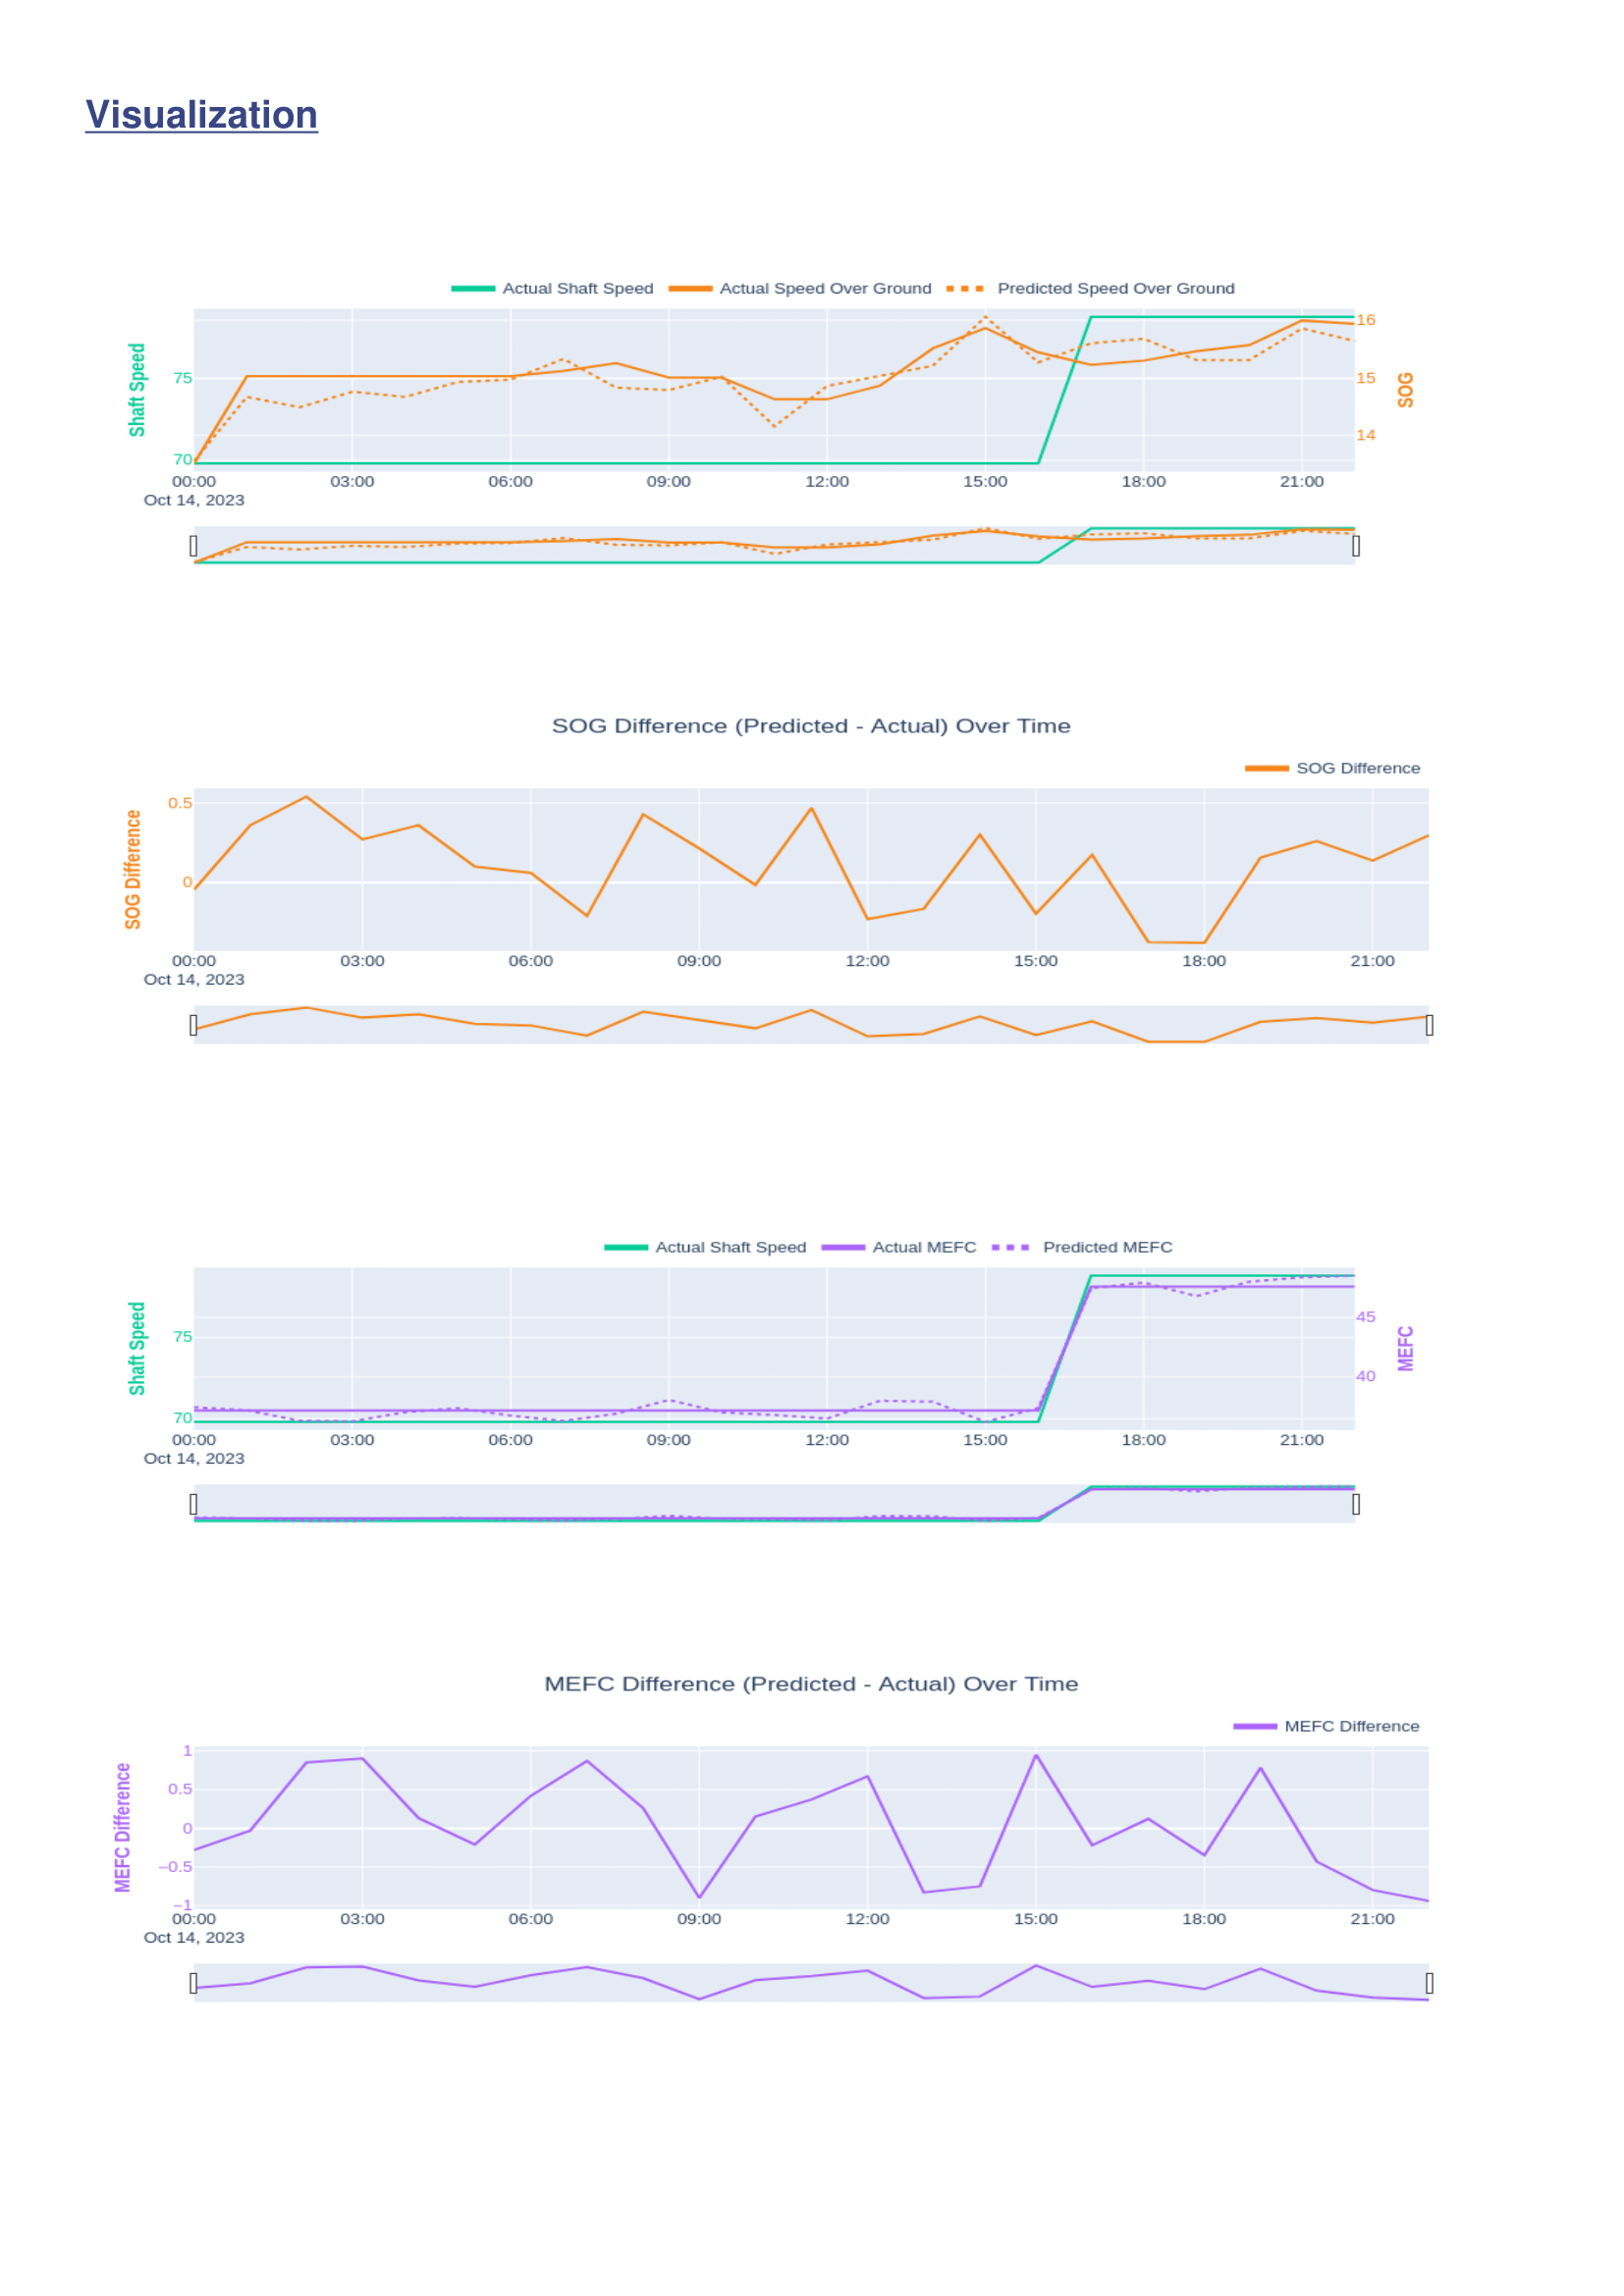
Together, these visuals provide an intuitive understanding of where the model performed well, where it struggled, and whether inaccuracies were systematic or isolated.
Final Thoughts
Automating model accuracy assessment fundamentally improved the reliability and scalability of the Voyage Optimization service. Instead of relying on a single-point comparison and subjective judgment, this tool enabled consistent, multi-point evaluation backed by quantitative metrics and clear visual evidence.
From an operational standpoint, the report allowed analysts and stakeholders to quickly identify degraded models, prioritize retraining efforts, and maintain confidence in optimization recommendations. From a product perspective, it standardized how model performance was measured and communicated across vessels and clients.
Personally, this project reinforced the importance of validation in predictive systems. Optimization is only as good as the models behind it, and without a transparent way to measure accuracy, even the best algorithms lose credibility. By turning model validation into an automated, repeatable, and easy-to-use process, this work helped ensure that voyage optimization remained both trustworthy and effective at scale.