At Nautilus, voyage optimization was the core service we provided. The goal of the service was to help client vessels achieve specific operational objectives—such as maximizing TCE or net profit, minimizing fuel consumption, or meeting a target ETA. To build trust and demonstrate the value of our recommendations, we produced Post-Voyage Reports (also referred to as Counterfactual Reports) after each voyage or on a monthly basis, depending on client preference.
These reports quantified the impact of following our recommendations by comparing a vessel’s actual performance—fuel consumption, speed over ground, and other key metrics—against a baseline. That baseline could be the vessel’s historical performance prior to using our service or a simulated “business-as-usual” scenario that assumed the vessel continued operating as it had before receiving our guidance.
Like voyage optimization itself, the post-voyage reporting process was highly manual, time-consuming, and subjective. Analysts had to manually extract historical vessel data from the platform, run multiple simulations independently, collect and reconcile the results, and then analyze the data to estimate fuel savings and TCE or net profit improvements.
Beyond the manual effort, the process varied significantly from client to client. Each report depended heavily on the individual analyst’s experience and judgment, making the workflow difficult to replicate and a major obstacle to scaling the service across more vessels and clients.
After successfully automating voyage optimization reporting, I turned my focus to applying the same principles and tools to post-voyage reporting. As a first step, I conducted interviews with both clients and internal stakeholders to better understand their needs and identify the right approach.
Client Feedback
From client interviews, several clear themes emerged:
-
Clients wanted simpler, more intuitive counterfactual reports that clearly highlighted the value created by our recommendations. Concrete and easily identifiable savings figures were especially important, as they helped clients justify the service internally and secure continued investment.
-
Timeliness was critical. Reports were often delivered weeks—or even months—after a voyage ended, by which point the operational context had faded, making the results harder to understand and less impactful.
Internal Stakeholder Feedback
Discussions with internal stakeholders—including analysts, client success managers, and product managers—revealed additional insights:
-
The report generation process needed to be standardized. Maintaining multiple counterfactual methodologies across clients created unnecessary complexity and hindered scalability.
-
The workflow needed to be fully automated. Even small manual steps compound quickly when generating reports for multiple vessels and clients. Data collection, simulation, analysis, visualization, and PDF generation all needed to happen with minimal human intervention.
-
The system had to be easy to use, enabling team members with little or no coding experience to generate reports reliably and consistently.
These insights laid the foundation for automating post-voyage reporting in a way that was scalable, transparent, and impactful for both clients and internal teams.
Design
After gathering feedback from both clients and internal stakeholders, I designed a solution implemented in a Jupyter Notebook that automated the end-to-end generation of the post-voyage report. The notebook followed a clear, repeatable pipeline:
-
Collect actual voyage data from the platform, including shaft speed, fuel consumption, and other key performance metrics.
-
Retrieve Nautilus recommendations issued during the voyage for comparison against actual vessel behavior.
-
Run a counterfactual simulation representing a “no-recommendation” scenario, assuming the vessel continued operating at the same speed it used prior to receiving the first recommendation for the remainder of the voyage.
-
Run optimization simulations across all feasible shaft speeds from the start of the voyage to identify the optimal shaft speed and the corresponding predicted performance metrics.
-
Calculate alignment percentage, measuring how often the vessel adhered to Nautilus’ recommended shaft speeds throughout the voyage.
-
Calculate realized savings by comparing the actual fuel cost (while following recommendations) against the simulated fuel cost in the no-recommendation scenario.
-
Calculate missed savings by comparing the actual fuel cost against the simulated fuel cost at the optimal shaft speed.
-
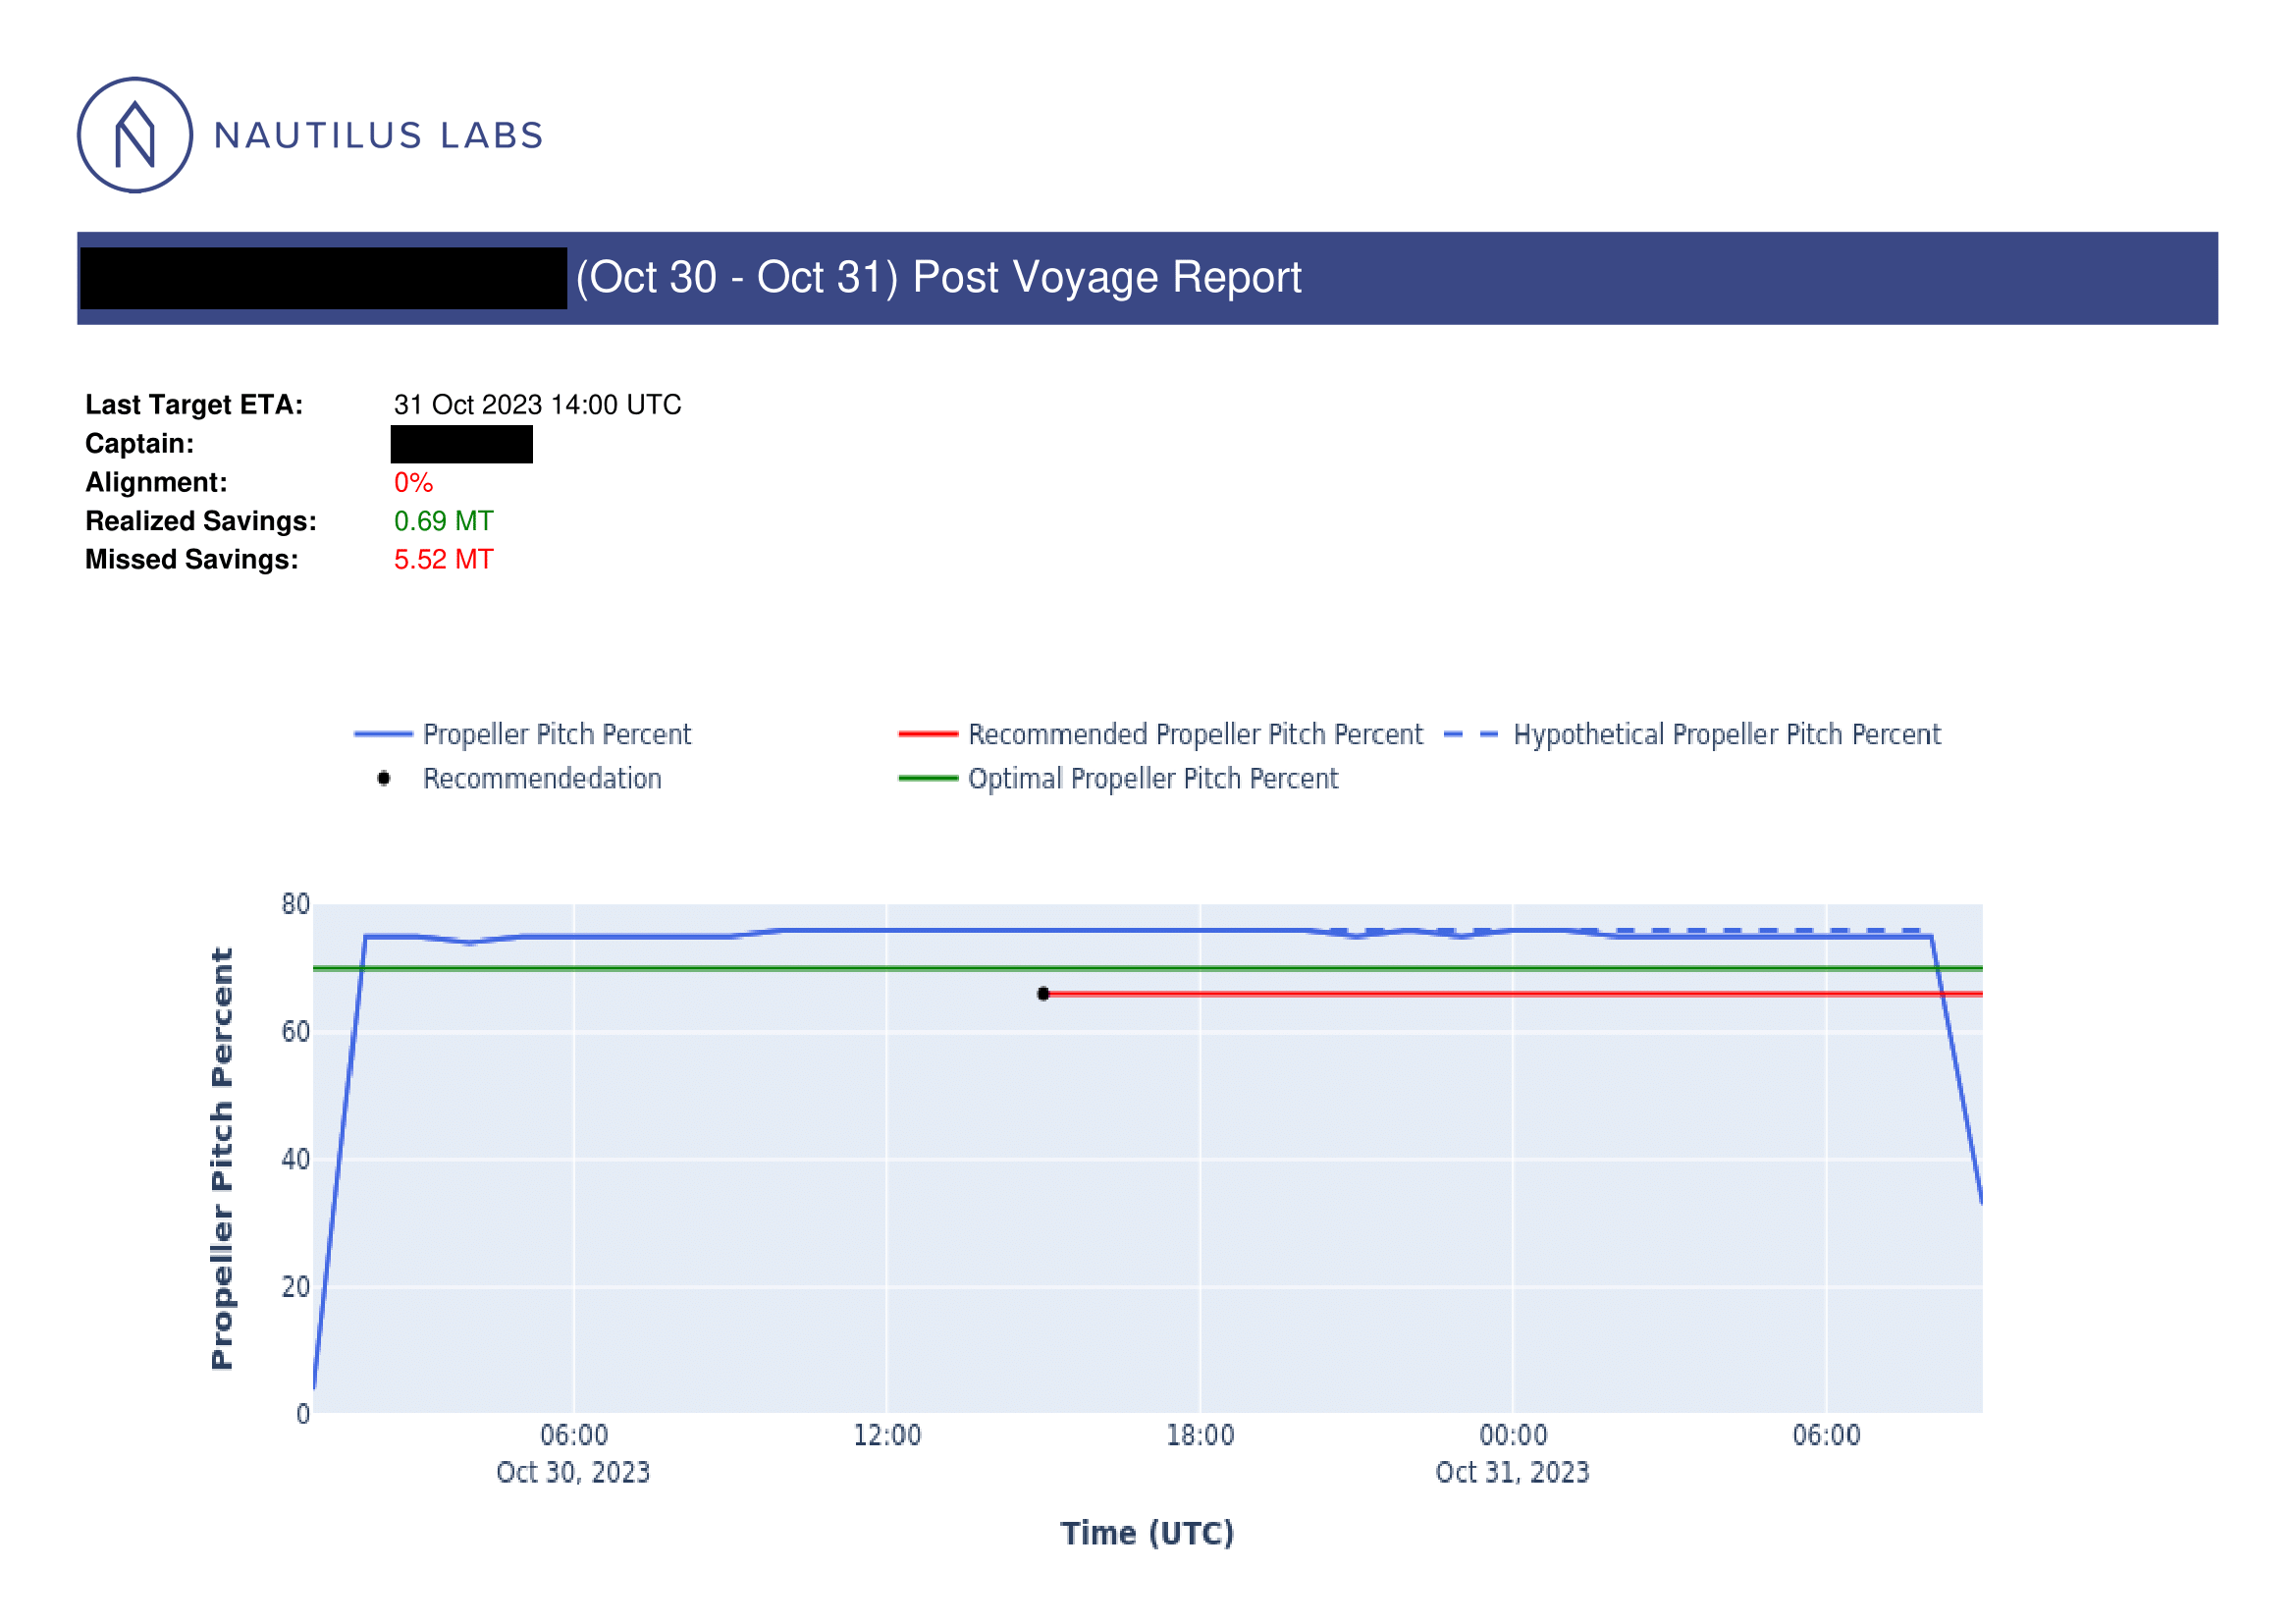
Generate a unified visualization showing actual shaft speed, recommended shaft speed, simulated shaft speed, and simulated optimal shaft speed on a single timeline.
-
Overlay key performance indicators—alignment percentage, realized savings, and missed savings—directly on the visualization.
-
Export the final report as a PDF, producing a client-ready artifact with minimal manual intervention.
This design ensured the reporting process was consistent, transparent, and scalable, while clearly communicating both the value delivered and the remaining optimization potential.
Final Thoughts
The Post Voyage Report was one of the most critical pieces in building trust in Nautilus’ voyage optimization service. While optimization recommendations influenced day-to-day operations, these reports were where clients truly saw the value—where theory met reality. Unfortunately, the original process was slow, manual, and highly dependent on individual analyst experience, which made it difficult to scale and even harder to deliver consistently.
Automating the Post Voyage Report was about more than saving time. It was about standardizing how success was measured and communicated. By clearly defining counterfactual scenarios, realized savings, missed opportunities, and alignment with recommendations, the tool turned a subjective and often delayed analysis into a repeatable, transparent, and timely deliverable. Clients could quickly understand not just that value was created, but how and why it was created. One of the most impactful outcomes was speed. Reports that once took weeks—or sometimes months—to produce could now be generated shortly after a voyage ended, while the operational context was still fresh. This dramatically improved client engagement and made the insights far more actionable, both for commercial teams justifying the service internally and for operators looking to improve future voyages.
From an internal perspective, this project reinforced the importance of scalability and simplicity. By designing the workflow so that reports could be generated with minimal technical knowledge and a single execution path, the process became accessible to the entire team rather than a small group of experienced analysts. That shift reduced risk, improved consistency, and aligned closely with the company’s long-term growth goals.
More broadly, this project deepened my appreciation for counterfactual analysis in operational products. Optimization only matters if you can credibly demonstrate its impact. By making that impact measurable, visual, and easy to understand, the Post Voyage Report became a cornerstone of how Nautilus communicated value. If you’re curious about the methodology, trade-offs, or assumptions behind these reports, I’d be happy to discuss them further—every voyage has a story, and this was how we learned to tell it clearly.