In recent years, emissions control has become a major focus for shipping companies. With the implementation of CII requirements and the EU ETS, operators are increasingly interested in tracking the CII score and AER of each vessel in their fleet.
Although the CII and AER scores of client vessels were available within the Nautilus platform</>, there was no comprehensive reporting system that could be shared with clients to help them track changes in AER and CII from voyage to voyage. We concluded that an automated report—similar to the Voyage Optimization and Post-Voyage Reports—would be a valuable addition to address this gap.
Because of my prior experience building automated PDF reports for voyage optimization, I was asked if I would be interested in working on emissions reporting. Up to that point, most of my work had focused on voyage optimization, so this presented an interesting new challenge, which I was excited to take on.
For this project, I partnered with a product manager and a product engineer to exchange ideas, design the report structure, and implement an automated solution. This collaboration was a different experience for me, as I had previously worked independently on most projects. Working as part of a team, seeing problems through different perspectives, and collaborating toward a shared solution was both insightful and rewarding.
Design
Similar to the Voyage Optimization Report, we designed the Voyage Emission Report to be concise, easy to read, and focused. The report was structured as a three-page PDF, with each page serving a distinct purpose:
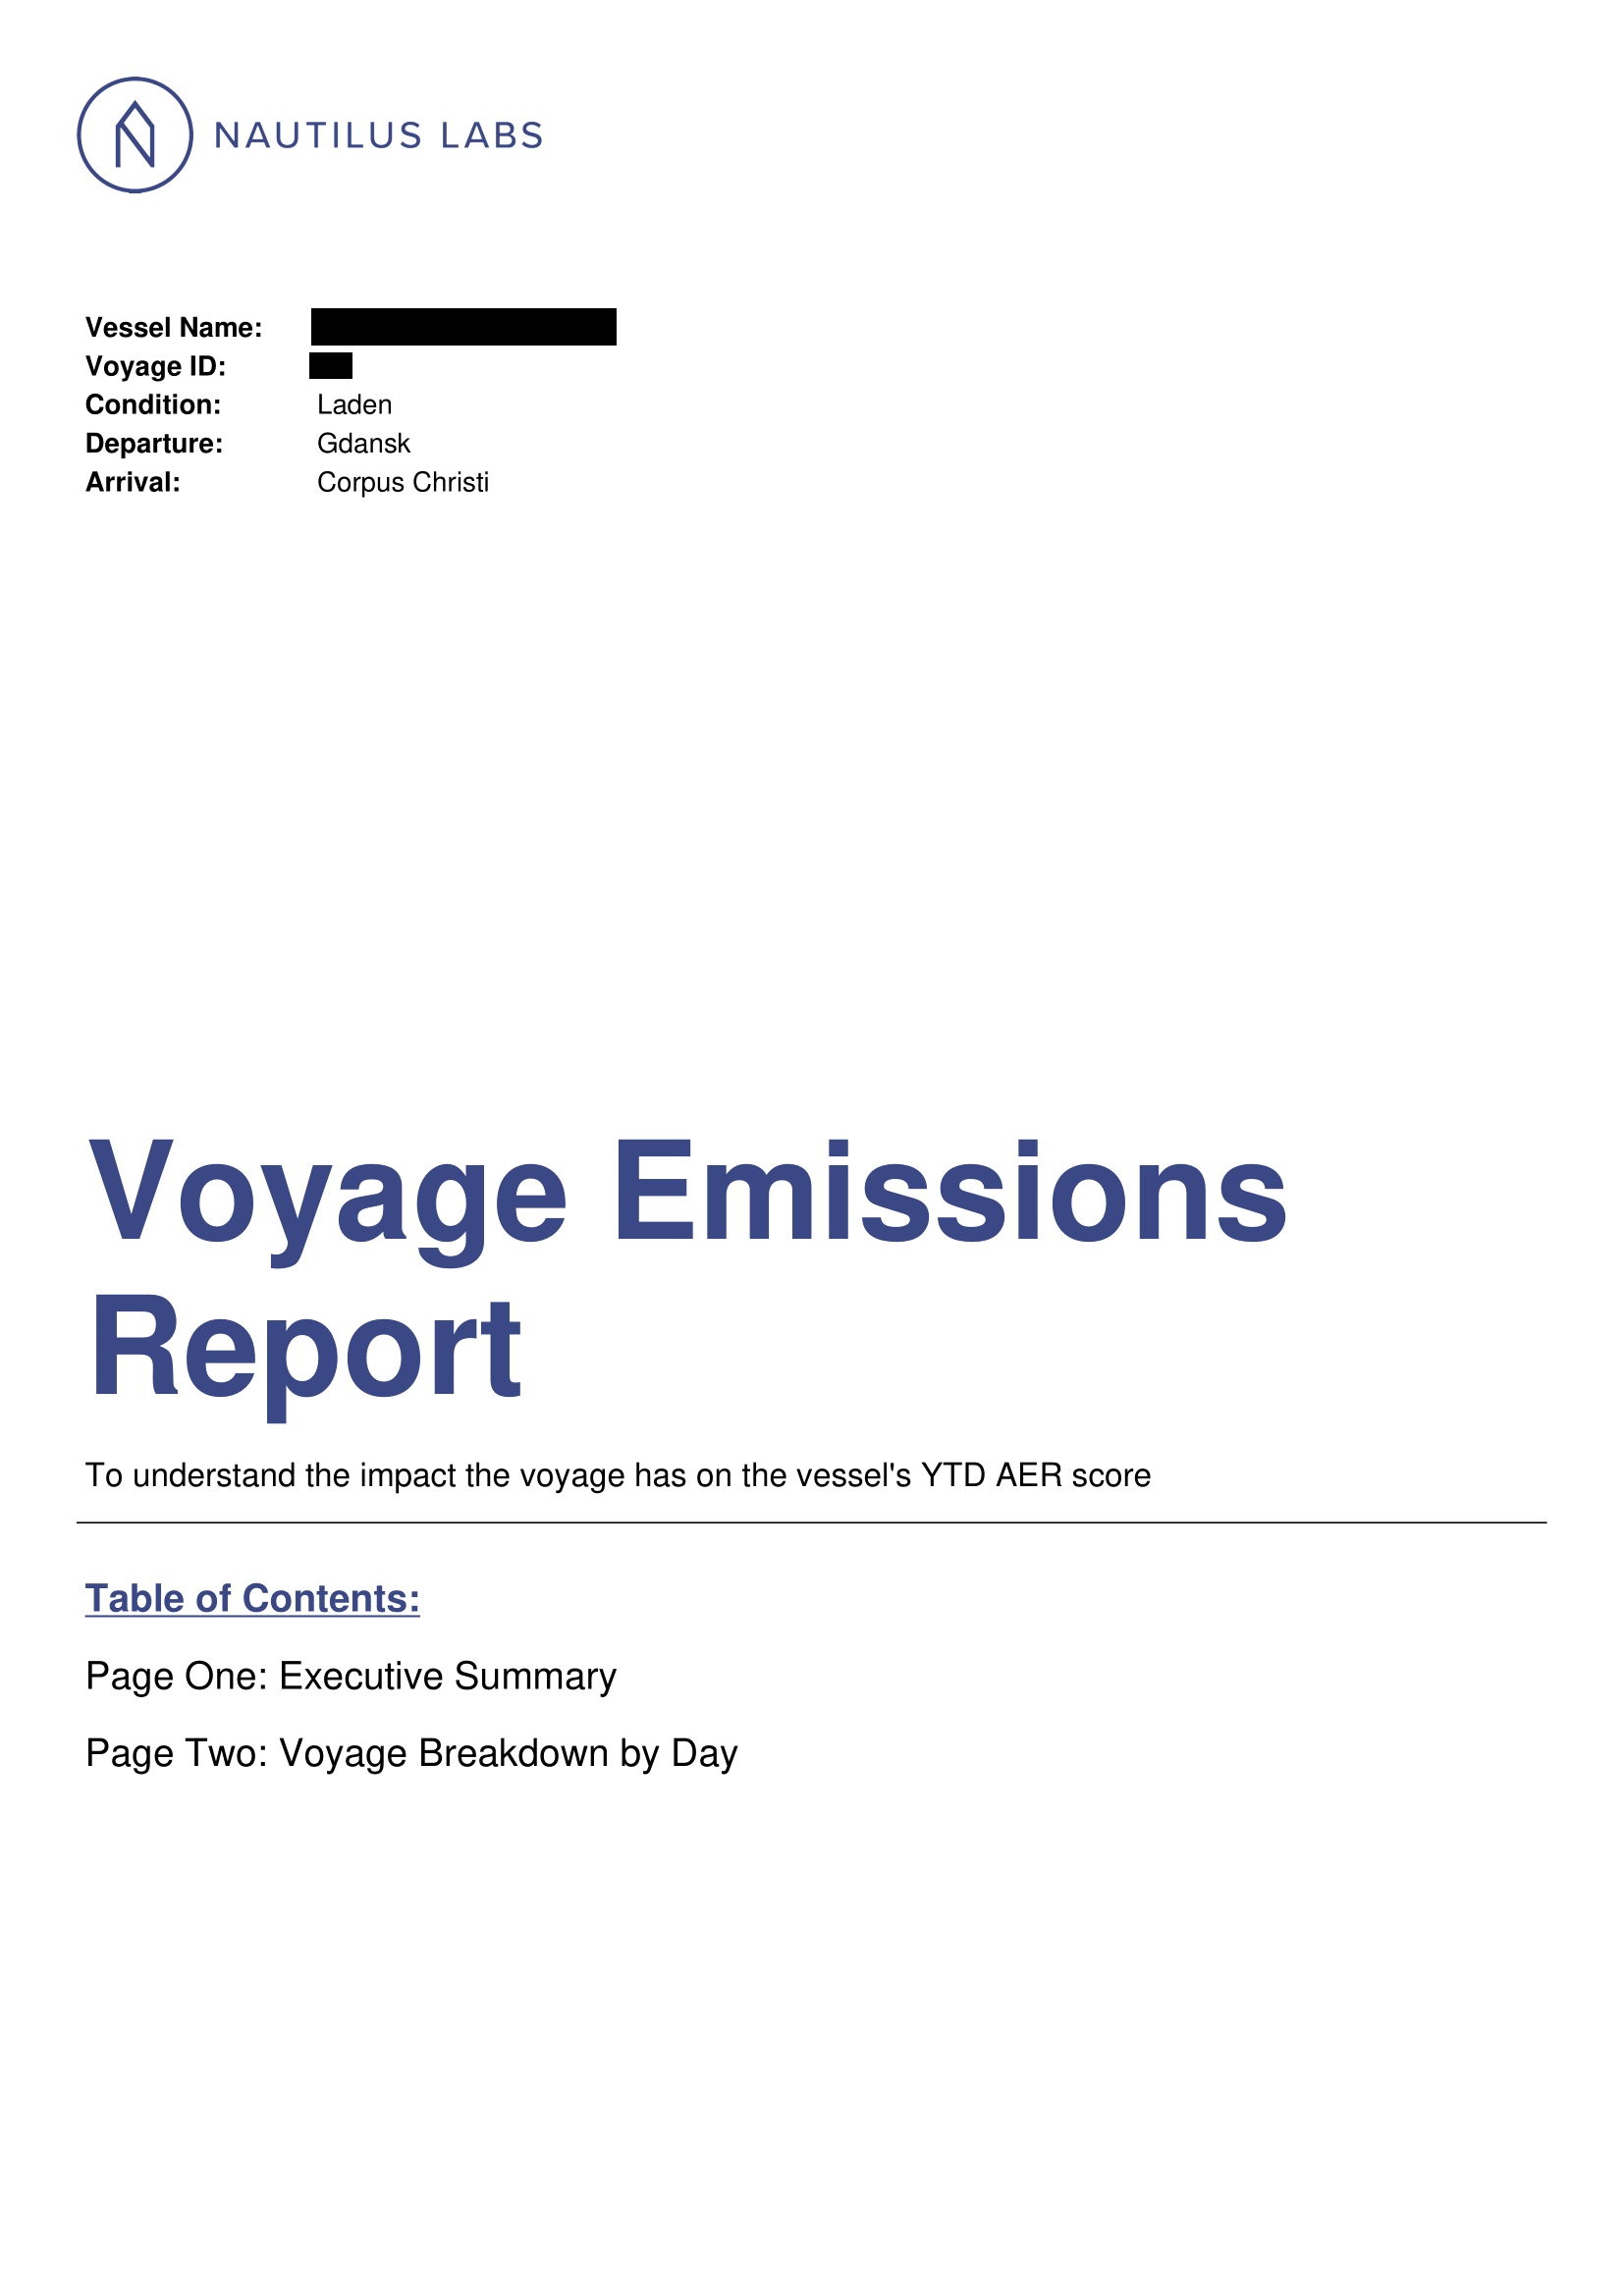
Page 1
The first page includes the report title, vessel metadata (such as vessel name, condition, departure, and arrival ports), and a table of contents. While it does not contain a detailed analysis, it sets the context and establishes clear expectations for the remainder of the report.
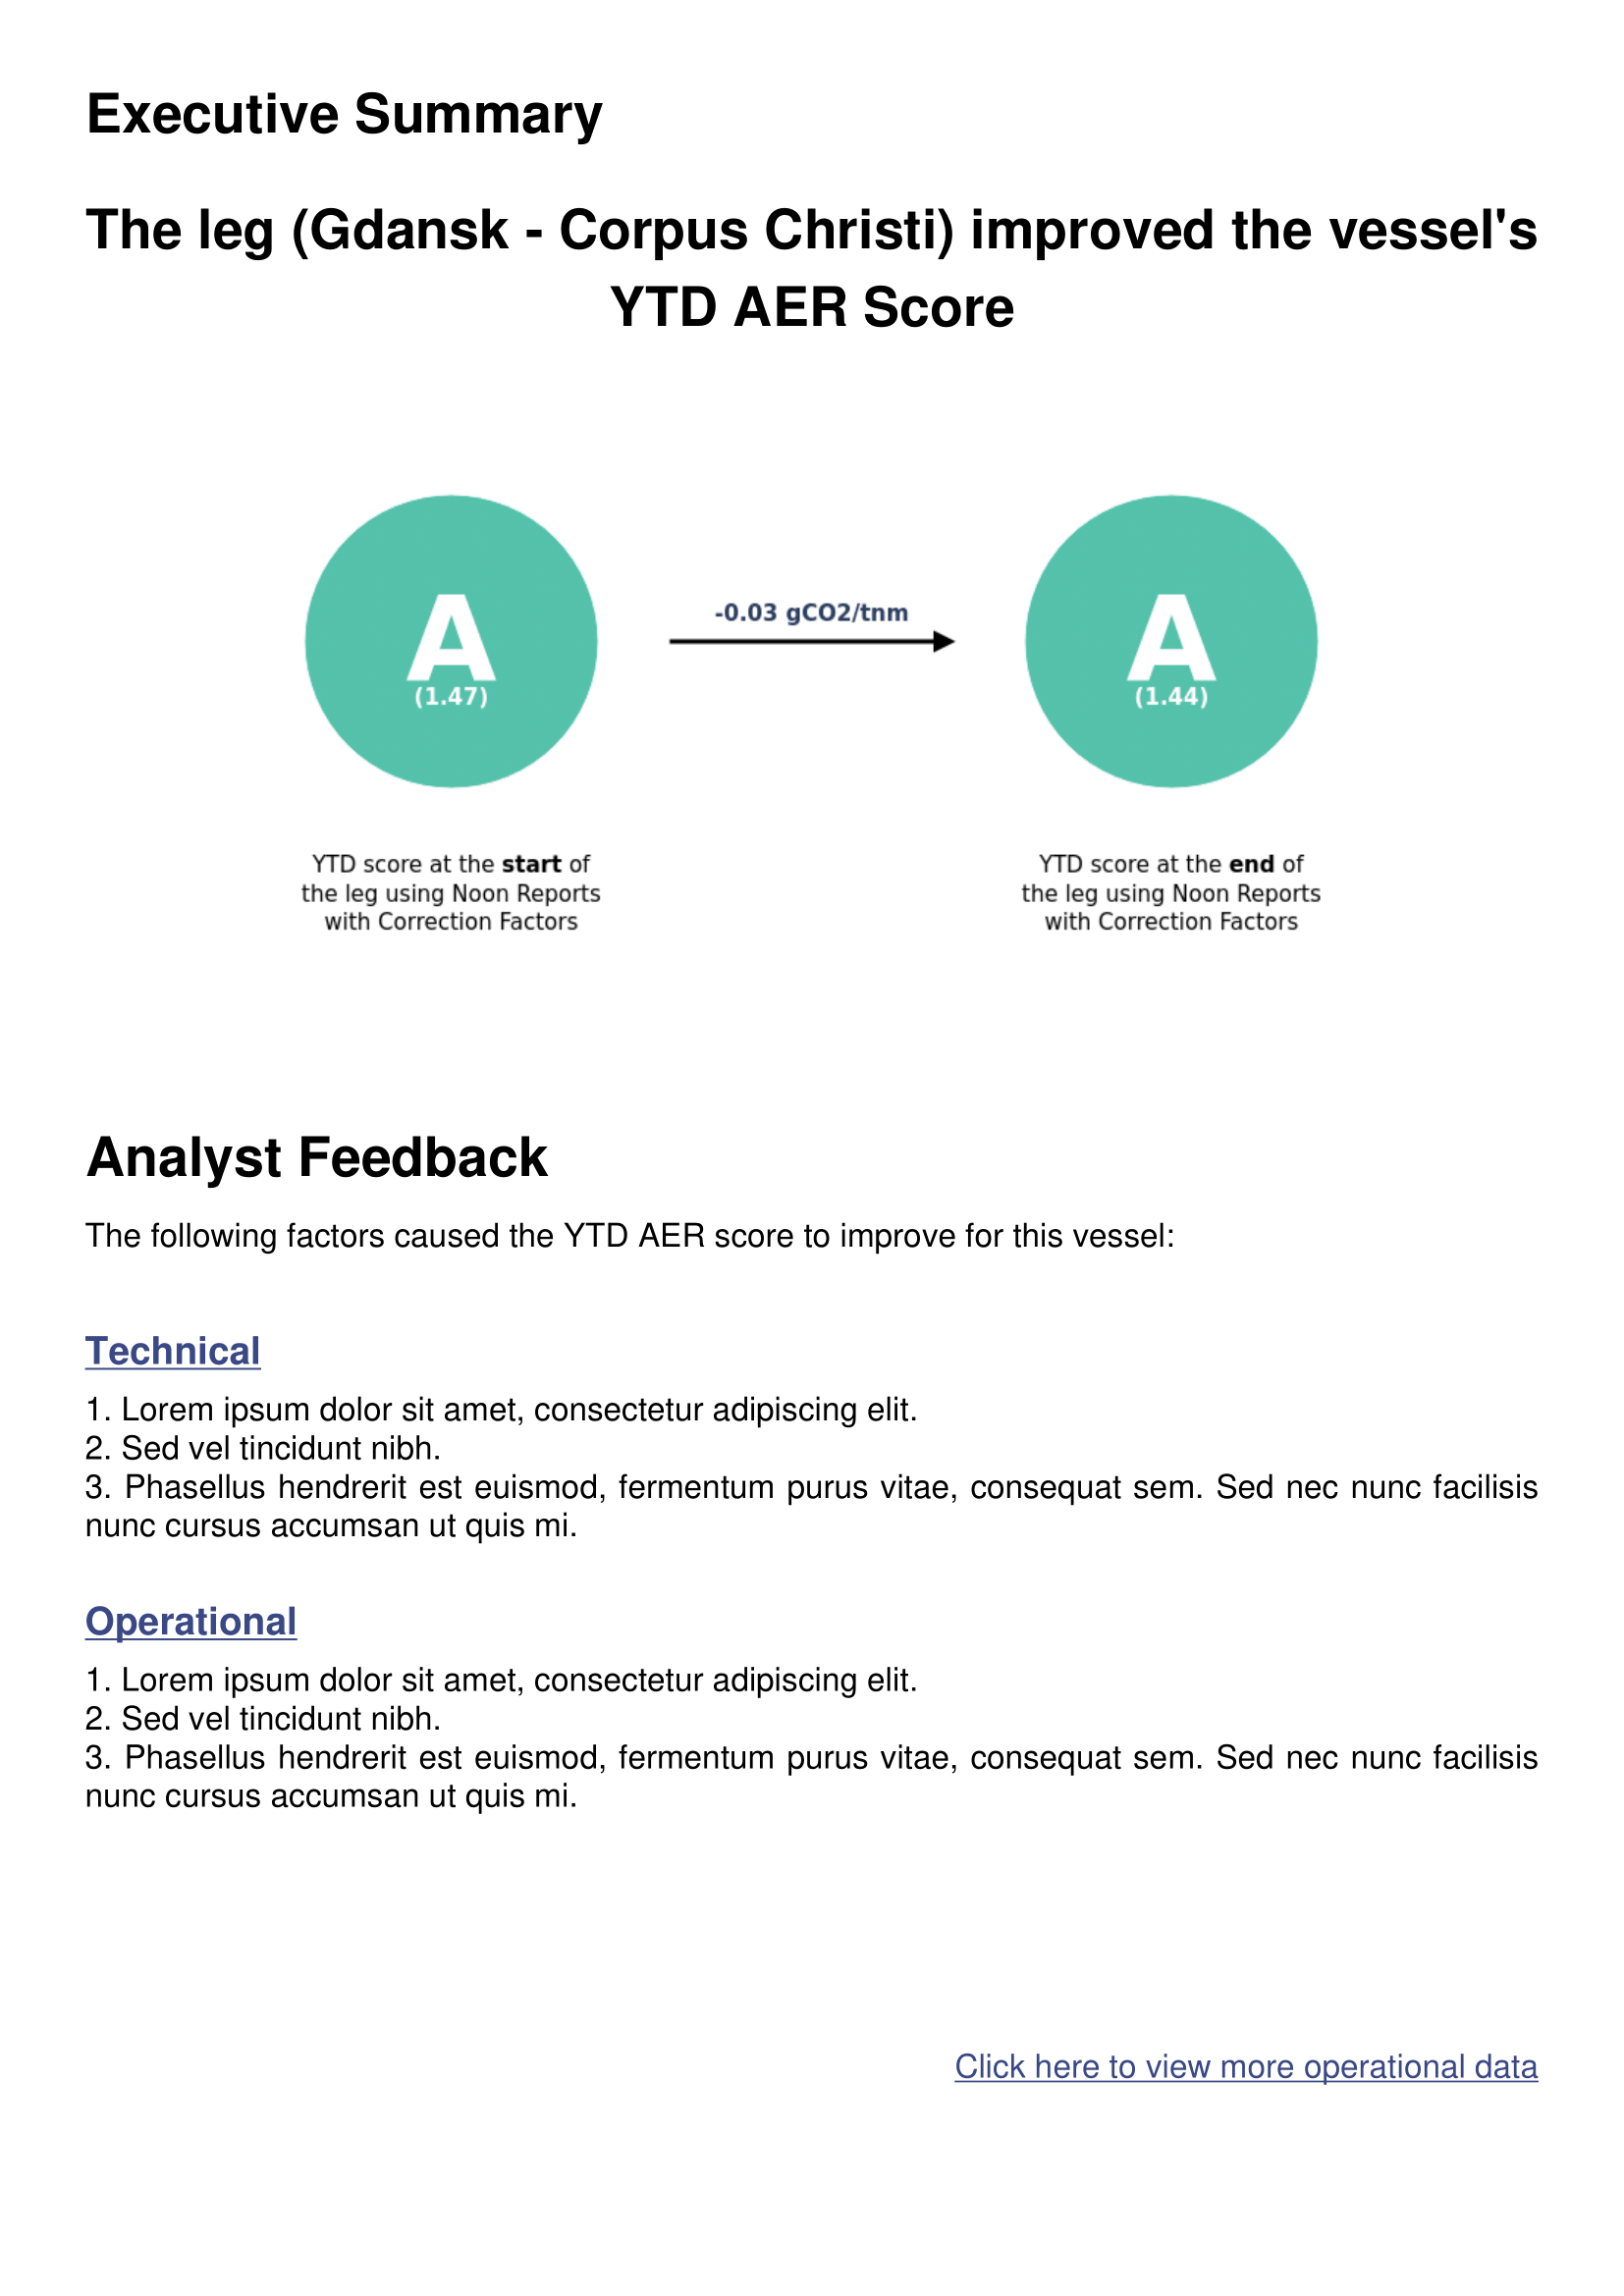
Page 2
The second page is the core of the report. It features an executive summary accompanied by visualizations showing how the vessel’s CII and AER scores changed over the course of the voyage. This page also includes analyst commentary explaining the potential causes of these changes from both technical and operational perspectives.
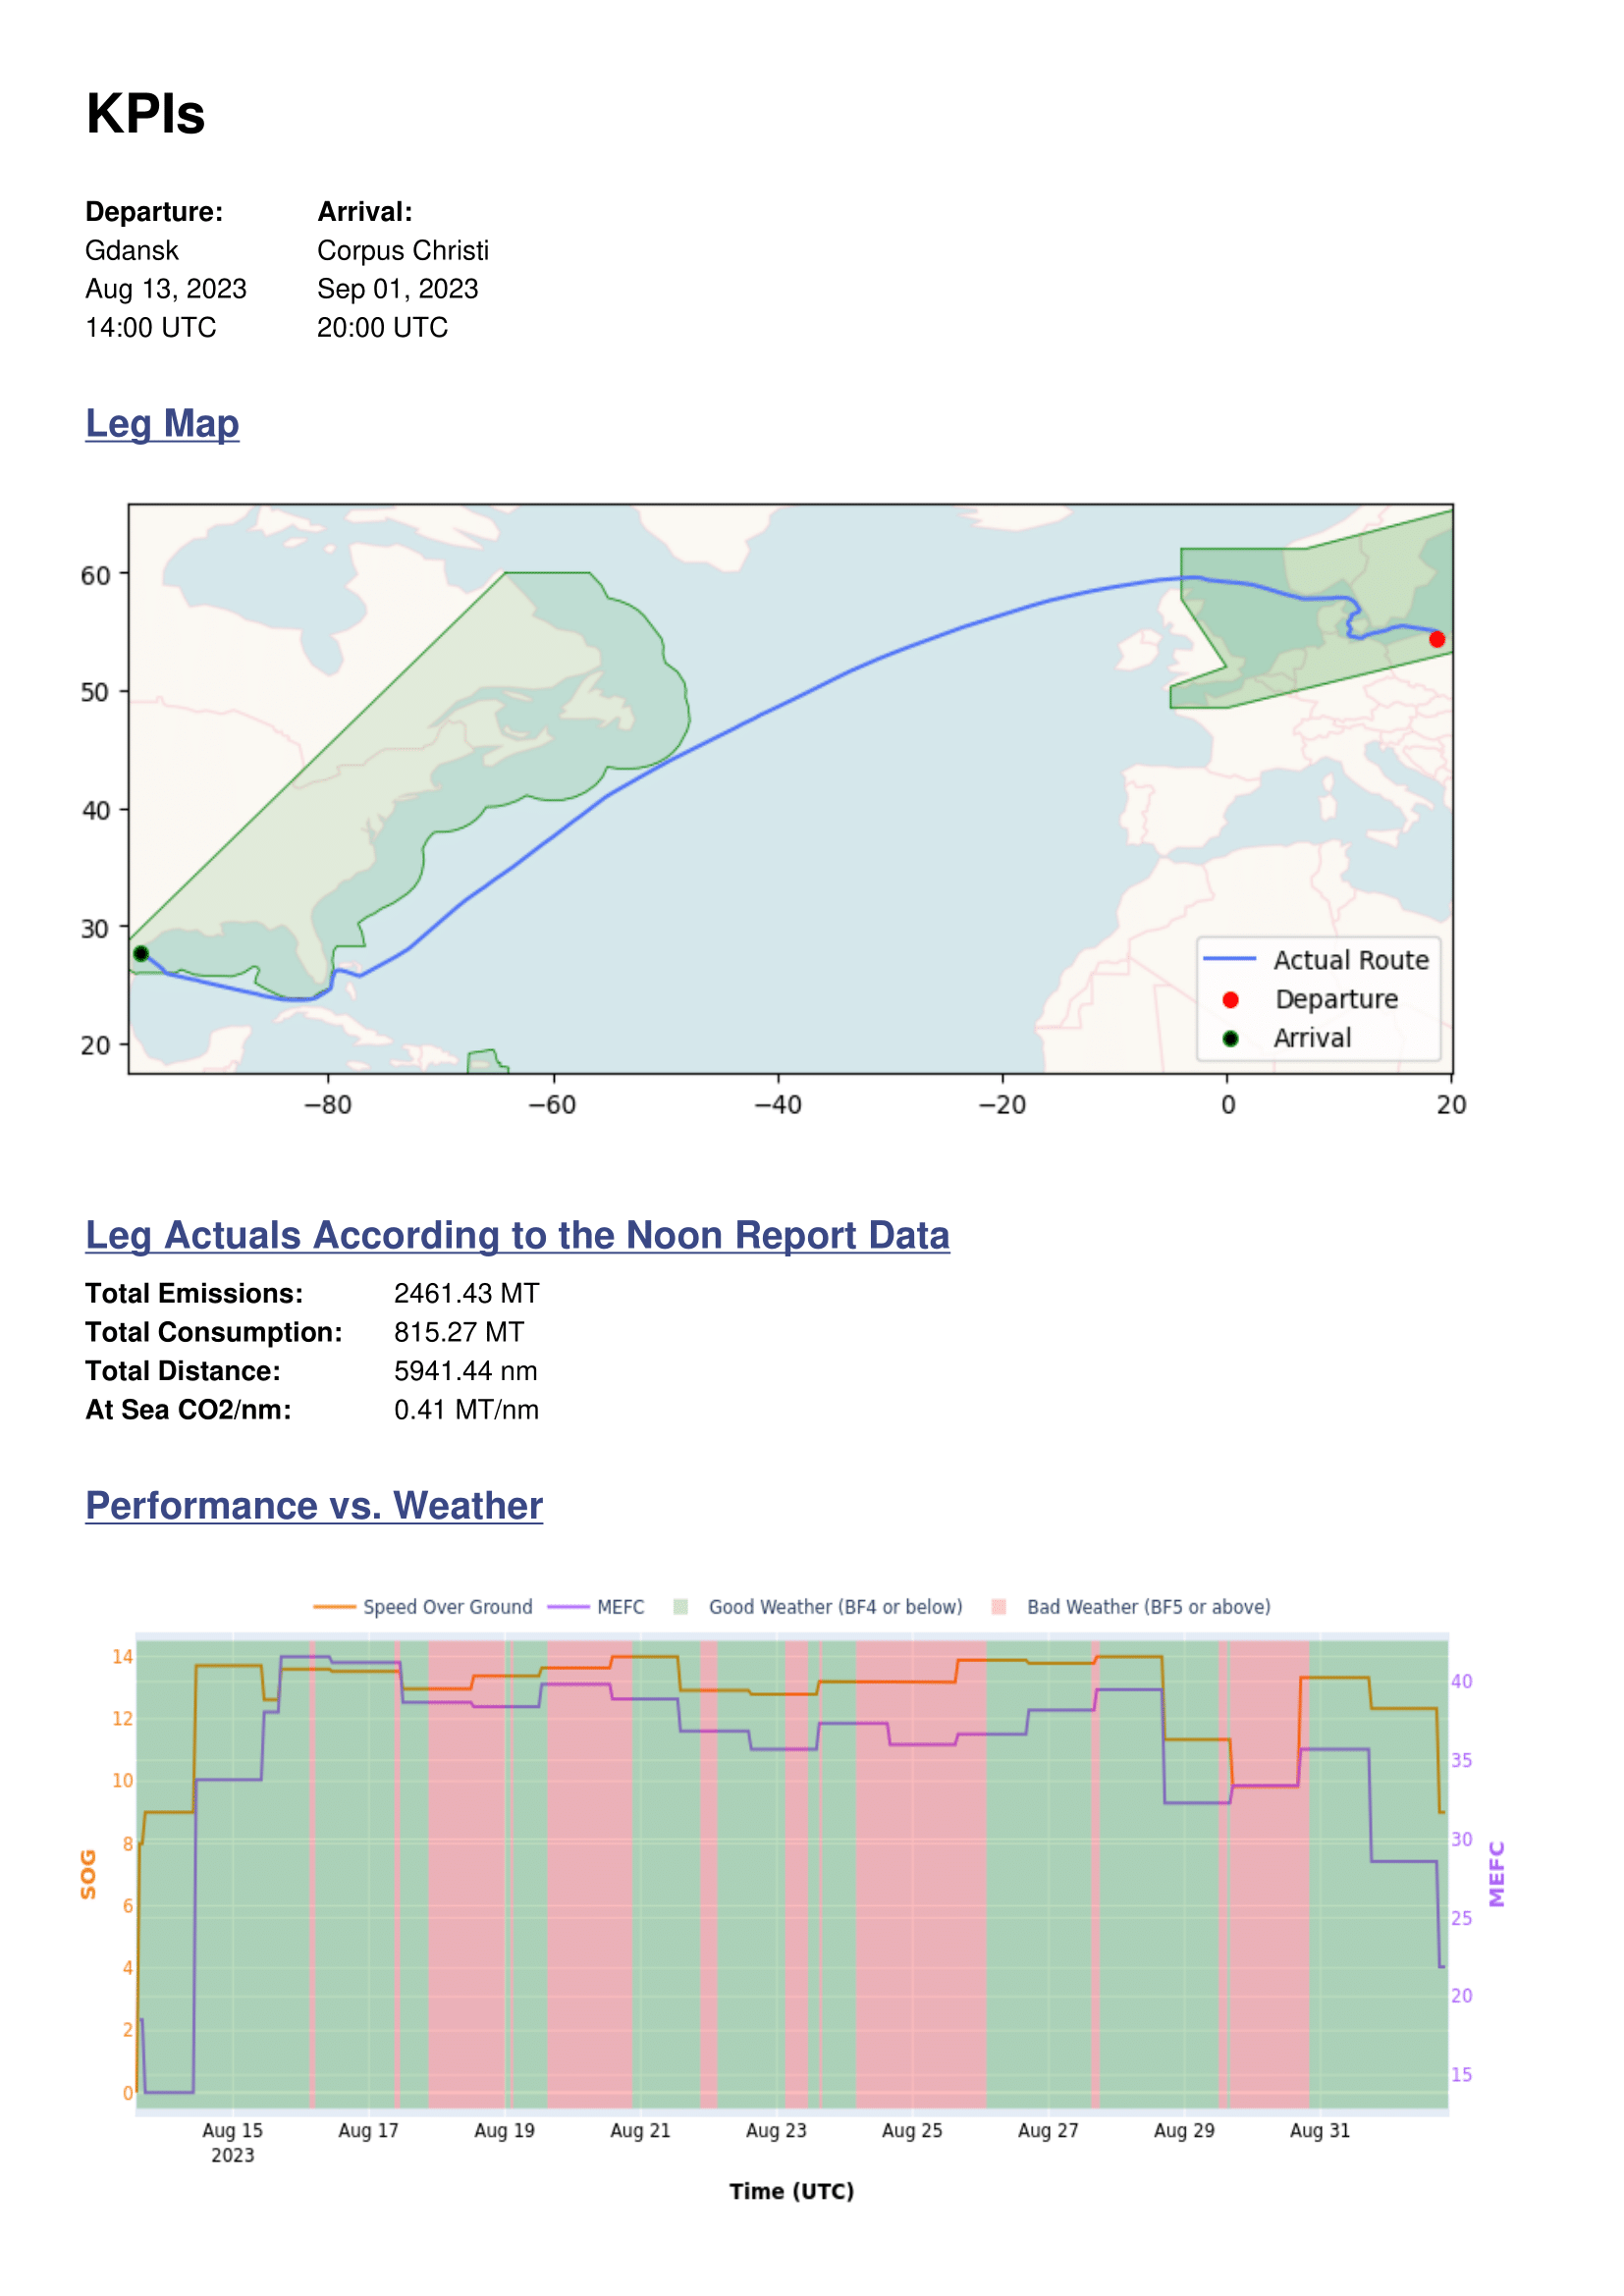
Page 3
The final page focuses on key performance indicators. It includes a map showing the vessel’s voyage track, summary voyage metrics such as fuel consumption, emissions, and distance traveled, as well as weather-related graphs illustrating how different conditions influenced vessel speed and fuel consumption.
Final Thoughts
The Voyage Emission Report addressed a growing and increasingly important need for transparency around emissions performance. While regulatory metrics like CII and AER were already available in the platform, they lacked context when viewed in isolation. This report turned those metrics into a clear, voyage-level narrative that clients could easily understand, track, and act upon.
From a product perspective, the biggest value of this project was standardization. By automating the calculation, visualization, and reporting of emissions data, we removed subjectivity and ensured consistency across vessels and clients. The three-page structure kept the report focused, while still providing enough depth for both technical teams and commercial stakeholders.
On a personal level, this project was meaningful because it pushed me outside my usual voyage optimization work and into a more collaborative, cross-functional environment. Working closely with product and engineering exposed me to new ways of thinking about problem-solving and reinforced the importance of alignment between technical accuracy, usability, and business value.
As emissions regulations continue to evolve, tools like this become essential—not just for compliance, but for long-term operational planning. This project reinforced a recurring lesson for me: data only becomes valuable when it is accessible, contextualized, and easy to communicate. The Voyage Emission Report was one step toward making that happen.